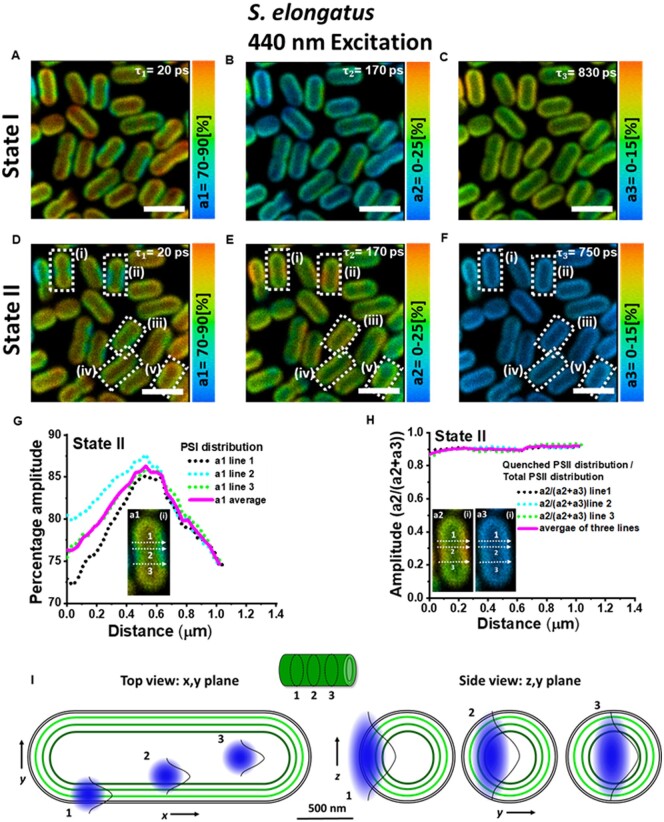
Figure 2.
Distribution of amplitudes associated with the fluorescence lifetimes in S. elongatus cells in States I and II. A–C, State I. D–F, State II. Corresponding lifetimes are written in the figures. Excitation wavelength was 440 nm and fluorescence was detected at 685–720 nm. Images are adjusted for brightness and contrast. Measurement was done at room temperature. Scale bar is 4 µm. On five representative cells (i–v) in State II (lower panel) enclosed in white rectangles, further analysis for State II characterization was performed. G, The profile of amplitude (a1) across three lines along the short axis of the first cell “(i).” H, The distribution of a2/(a2+a3) across the same three lines as in (G). Cell “i” is shown in inset in (G) and (H). Analysis on cells “ii–v” is shown in Supplemental Figure S5. I, Schematic representation of the dimensions of the thylakoids (green) in S. elongatus with respect to the confocal observation volume (blue). Three observation volumes are indicated in the x, y and y, z plane.

