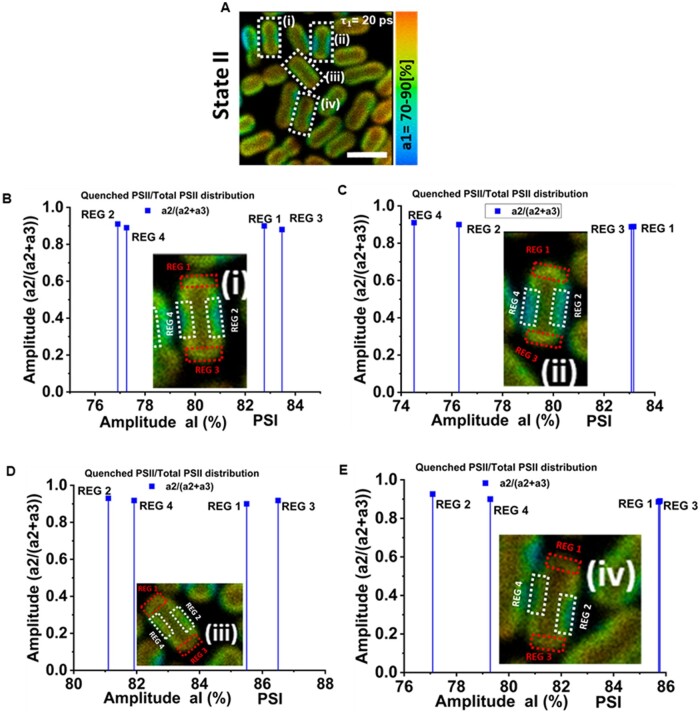
Figure 3.
Correlation between PSI distribution and PSII quenching. A, Distribution of amplitude associated with PSI fluorescence lifetime component (20 ps) in State II cells. On cells “i–iv” marked within white rectangles, further analysis was performed to investigate the correlation between the PSI percentage and ratio of quenched PSII/total PSII (a2/[a2+a3]) in specific cell regions. B–E, Fraction of quenched PSII of (a2/[a2+a3]) versus the average PSI amplitude in REG 1, REG 2, REG 3, and REG 4 of the cells “i–iv”, respectively. Cells “i–iv” are shown in inset. “REG 1” and “REG 3” shown with red rectangles represent domains in the cell with higher PSI content. “REG 2” and “REG 4” shown with white rectangles represent domains in the cell with lower PSI content.

