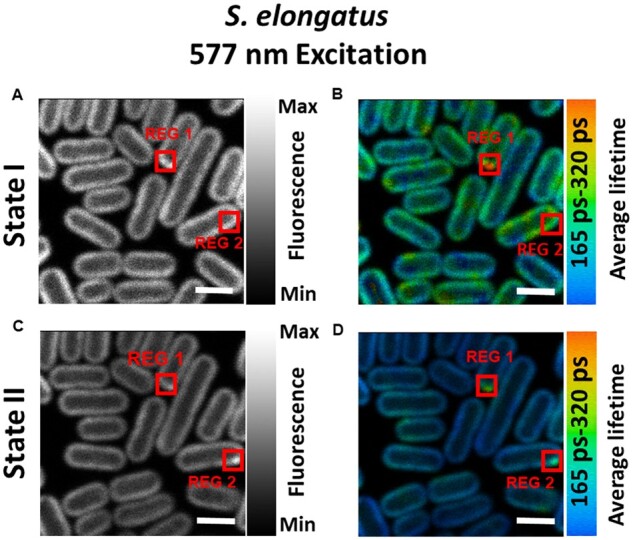
Figure 4.

Confocal fluorescence microscope images of S. elongatus cells adapted to States I and II. A and C, Steady-state intensity images of cells in States I and II, respectively. B and D, Average lifetime distributions in States I- and II-adapted cells. Same cells were imaged for both States I and II measurements. Excitation wavelength was 577 nm and fluorescence was recorded at 685–720 nm. Measurements were done at room temperature. “REG 1” in all figures, enclosed in red boxes, shows the area where fluorescence (A and C) and average lifetime (B and D) is higher than the rest of the cell. “REG 2” shows the area of high fluorescence (C) and average lifetime (D) in State II cells. “REG 2” in (A and B) is drawn for comparison with “REG 2” in (C and D). All images are equally adjusted for brightness and contrast. Scale bar is 2 µm. See Supplemental Figure S8 for reproducibility of States I and II observed upon selective excitation of PBSs.
