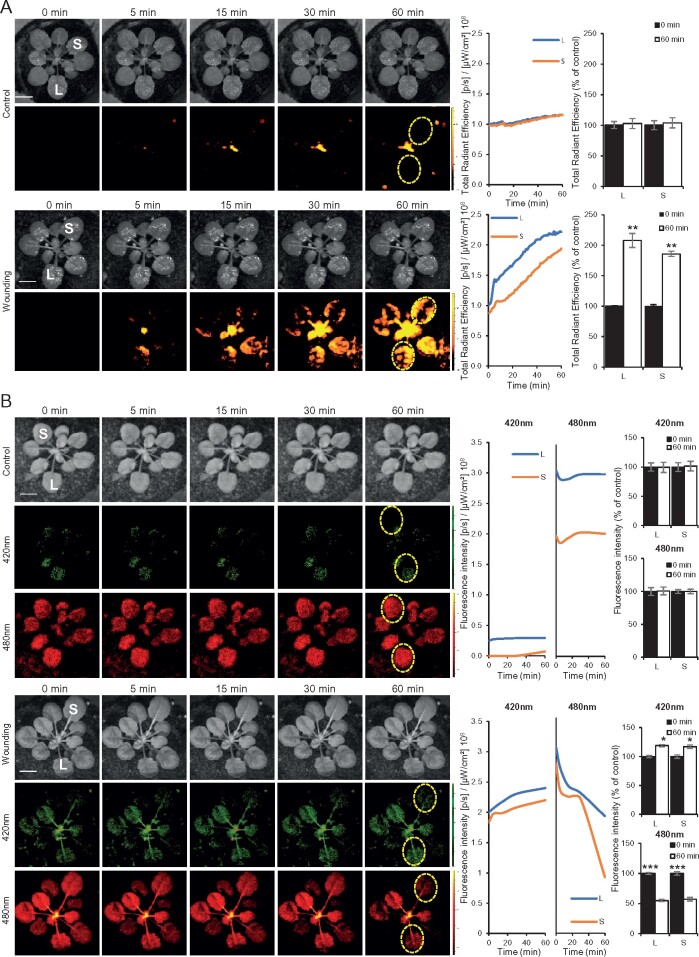
Figure 1.
Imaging of ROS and redox levels in whole plants subjected to wounding. A, Left: Representative time-lapse images of whole-plant ROS levels (indicated by DCF oxidation) in wild-type Arabidopsis (Col-0) plants, untreated (control, top), or wounded (bottom; applied to the local leaf only). Middle: Representative line graphs showing continuous measurements of ROS levels in local and systemic leaves over the entire course of the experiment (0–60 min; ROIs used to generate the line graphs are indicated with dashed yellow ovals on left). Right: Statistical analysis of ROS levels in local and systemic leaves at 0 and 60 min. B, Representative time-lapse images, and line and bar graphs, of roGFP1 fluorescence of transgenic plants overexpressing the roGFP1 protein at the cytosol (Jiang et al., 2006), untreated (top), or subjected to wounding applied to leaf L only (bottom; similar to the experimental set up shown in A). roGFP1 fluorescence was measured at excitation/emission (ex/em) of 420/520 nm for oxidized roGFP1 (middle, in green; oxidized), and at ex/em of 480/520 nm (bottom, in red; reduced). Experiments were conducted in three biological repeats, each with two technical repeats. Student’s t test, SE, N = 3, *P < 0.05, **P < 0.01, ***P < 0.005. Scale bar indicates 1 cm. ex/em, excitation/emission; L, local; S, systemic; and ROI, region of interest.

