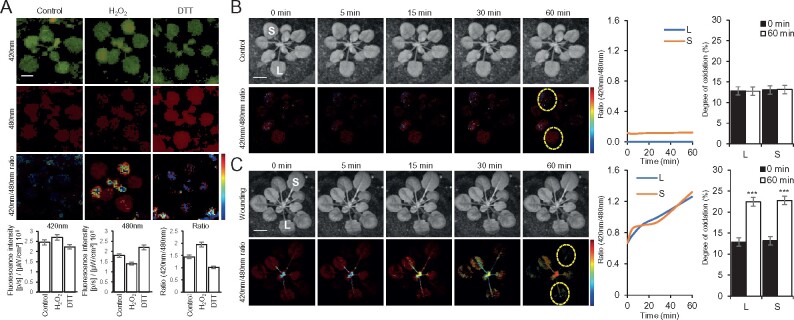
Figure 2.
Whole-plant ratiometric fluorescence measurements of cytosolic roGFP1-expressing plants subjected to wounding. A, Representative images of whole-plant roGFP1 florescence (top; 420 and 480 nm excitations are in green and red, respectively), and statistical analysis of 420, 480, and 420/480 nm ratio (bottom) of untreated cytosolic roGFP1 plants (Control), or cytosolic roGFP1 plants subjected to a 15 min fumigation with 5 mM hydrogen peroxide (H2O2), or 5 mM DTT. Ratios of florescence intensities obtained from the H2O2 and DTT treatments were used for calculating the degree of roGFP1 oxidation (similar to Schwarzländer et al., 2008) shown in B. B, Representative time-lapse images (left), line graphs of 420/480 nm ratio for the entire time course (ROIs used to generate the graphs are shown in the images as dotted yellow ovals; middle), and bar graphs showing the degree of roGFP1 oxidation for the 0- and 60-min time points in local (L) and systemic (S) leaves calculated using the normalization range obtained in A, generated for the control untreated plants shown in Figure 1, B, top panels. C, Same as in B, but for the wounded plants shown in Figure 1, B, bottom panels. Experiments were conducted in three biological repeats, each with two technical repeats. Student’s t test, SE, N = 3, *P < 0.05. Scale bar indicates 1 cm. L, local; S, systemic; ROI, region of interest.

