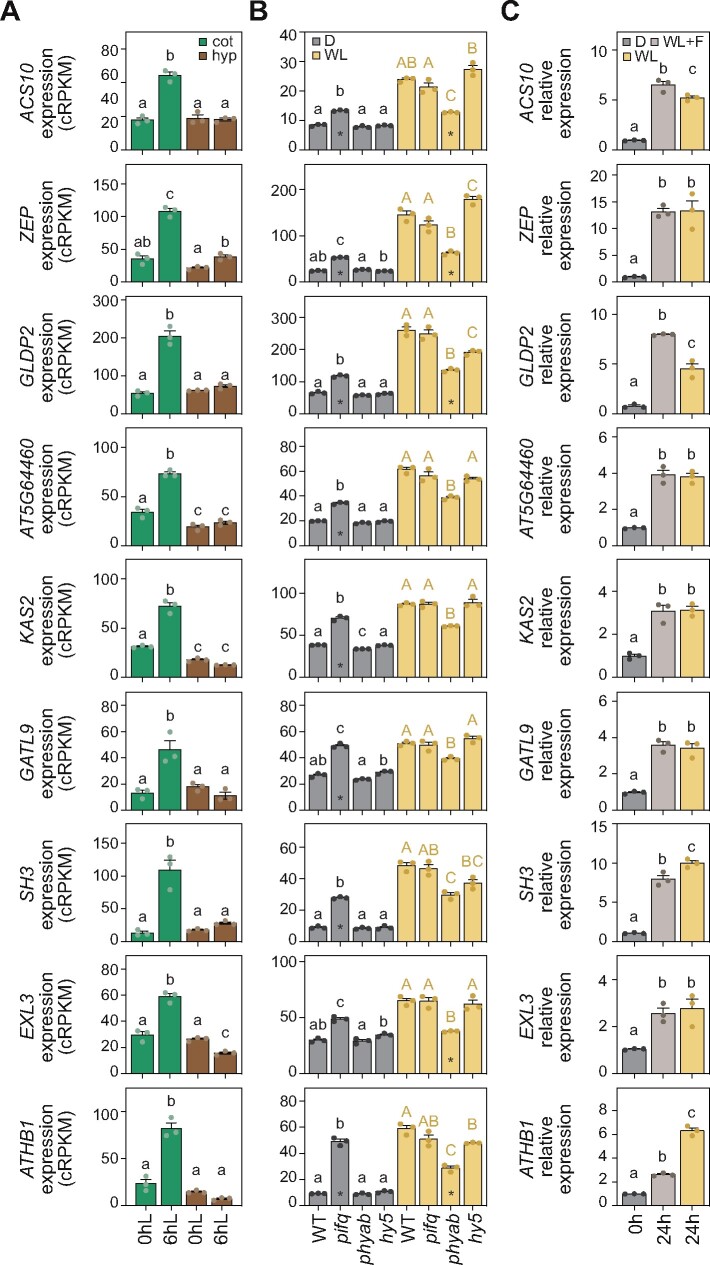
Figure 4.
Gene expression analysis of putative cotyledon-expansion molecular markers. (A) Expression values of selected cotyledon-expansion marker genes in cotyledon and hypocotyl samples from Sun et al. (2016) collected in the dark and after 6 h of light. (B) Expression values from RNA-seq data of the set of genes analyzed in A in WT, pifq, hy5-2, and phyab seedlings grown for 3 d in darkness or light. Asterisks indicate a change of at least 1.5-fold. (C) RT-qPCR analysis of the set of genes analyzed in A and B in WT seedlings grown for 2 d in the dark and then treated for 24 h with dark (D), WL, or white light and fluridone (WL + F). Expression of each gene was normalized to that of PP2A and transcript expressed relative to the value of dark set to one. In A–C, data represent the mean ± SE of three biological replicates, and different letters denote statistically significant differences between means (Tukey test; P < 0.05).

