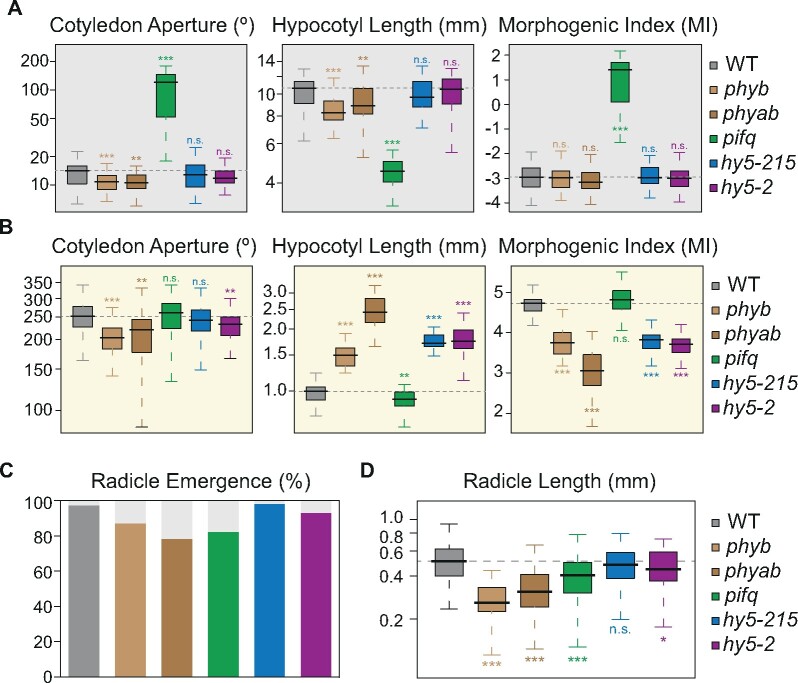
Figure 5.
MI assessment of seedling development in light-signaling mutants. (A–B) Boxplot representation of the cotyledon aperture (left), hypocotyl length (center), and MI (right) of seedlings of different genotypes grown in continuous dark (A) or light (B) for 3 d (n ≥ 44). (MI, log2 of cotyledon angle/10*hypocotyl length). (C–D) Percentage of emerged radicles (C) and boxplot representation of the radicle length (D), both measured upon 24 h in darkness after stratification of WT and different light-signaling mutant seeds (n ≥ 45). Boxplots indicate the median (center line), interquartile range (box limits), and minimum and maximum values (whiskers). In A–B and D, asterisks indicate statistically significant differences between each mutant and WT seedlings (Mann–Whitney test; *P < 0.05, **P < 0.01, ***P < 0.001).

