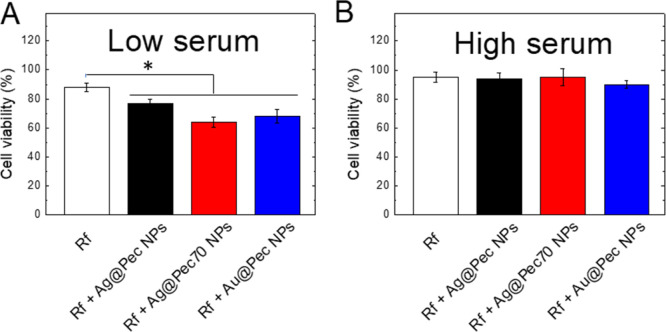
Figure 4.
Bar graphs showing the results of the MTT assays on irradiated HeLa cells incubated in (A) LS- or (B) HS-supplemented MEM in the presence of Rf or Rf + Me@Pec NPs (Ag@Pec NPs-black-, Ag@Pec70 NPs-red-,or Au@Pec NPs-blue-). All data are presented as mean ± SE from four to eight independent experiments (*p < 0.05, one-way ANOVA with Tukey’s post hoc test.).

