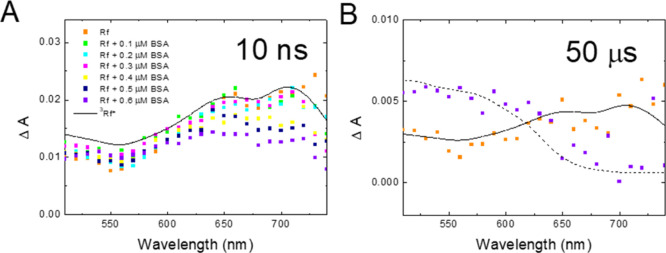
Figure 7.
(A) Transient absorption spectra taken 10 ns after the laser shot for Ar-saturated samples containing 50 μM Rf and BSA in the range from 0 to 0.6 μM as indicated. (B) Transient absorption spectra taken 50 μs after the laser shot for Ar-saturated samples containing 50 μM Rf in the absence (orange) and in the presence (purple) of 0.6 μM BSA. Solid and dashed lines show the reported spectra for 3Rf* and HRf•, respectively, from the study of Li et al.(36)

