
Figure 15.
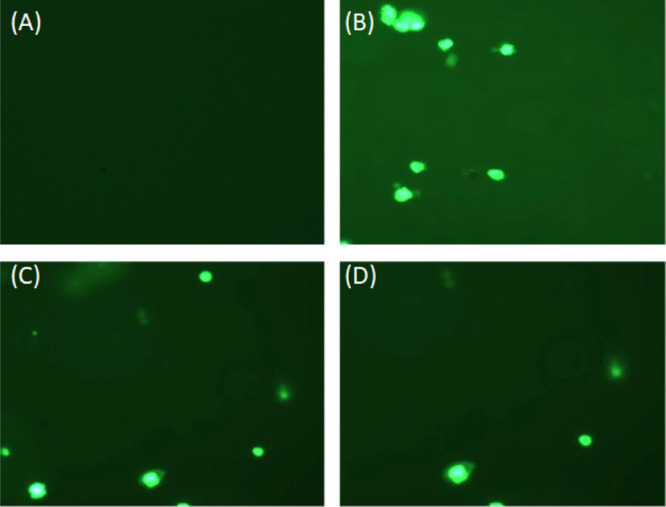
Intracellular production of ROS in lymphocytes. Representative fluorescent microscopic images of lymphocytes isolated from (A) normal rats, (B) diabetic rats, (C) diabetic rats treated with the lower dose of thiamine, and(D) diabetic rats treated with the higher dose of thiamine.