
Figure 3.
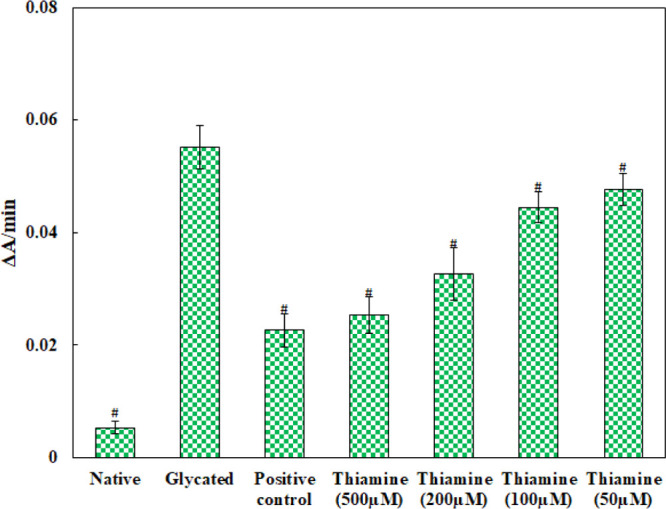
Extent of glycation in different protein samples. Aminoguanidine is the positive control; # indicates significantly different from the glycated group sample at p ≤ 0.05.
Official websites use .gov
A
.gov website belongs to an official
government organization in the United States.
Secure .gov websites use HTTPS
A lock (
) or https:// means you've safely
connected to the .gov website. Share sensitive
information only on official, secure websites.
Extent of glycation in different protein samples. Aminoguanidine is the positive control; # indicates significantly different from the glycated group sample at p ≤ 0.05.