Figure 1.

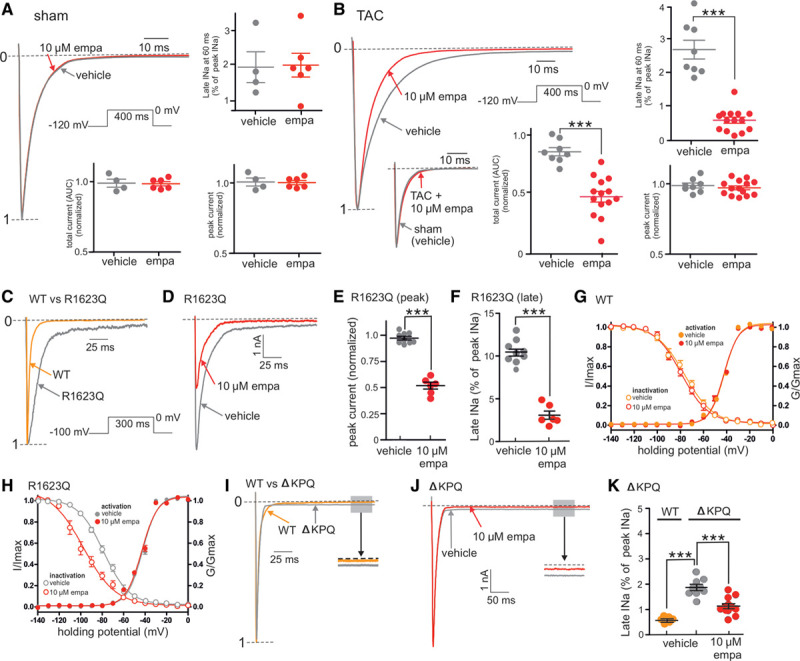
Empagliflozin inhibits the late component of the cardiac sodium channel current (late-INa) in heart failure and long QT syndrome 3. A, Representative whole-cell patch-clamp recording and grouped data showing the lack of effect of empagliflozin (10 µmol/L, empa) on peak, late, or total sodium currents from single cardiomyocytes isolated from sham-operated hearts. B, Representative whole-cell patch-clamp recording and grouped data showing the effects of empa (10 µmol/L) on sodium currents from single cardiomyocytes isolated from transverse aortic constriction–operated hearts in heart failure. Grouped data are from 5 to 15 cardiomyocytes per group. AUC indicates area under the curve. ***P<0.001, unpaired t test. C, Representative whole-cell patch-clamp recordings of recombinant Nav1.5 channel sodium currents from either wild-type (WT) or the long QT syndrome 3 (LQT3) R1623Q mutant. D, Representative whole-cell patch-clamp recordings showing the effects of empa (10 µmol/L) on sodium currents from the R1623Q mutant Nav1.5 channel. E and F, Grouped data showing the inhibitory effects of empa on peak- and late-INa, respectively, in the R1623Q mutant. G and H, Grouped data showing the effects of empa (10 µmol/L) on the activation and inactivation curves from WT (G) and R1623Q mutant Nav1.5 channels (H). I, Representative whole-cell patch-clamp recordings of recombinant Nav1.5 channel sodium currents from either WT or the LQT3 ΔKPQ mutant Nav1.5 channel. J, Representative whole-cell patch-clamp recordings showing the effects of empa (10 µmol/L) on sodium currents from the ΔKPQ mutant Nav1.5 channel. K, Grouped data showing magnitude of late-INa in WT and ΔKPQ mutant and the effects of empa (10 µmol/L) on sodium currents from the ΔKPQ mutant. Grouped data in E through H and K are from 6 to 9 cell recordings per group. E and F, ***P<0.001, paired t test. K, WT vs ΔKPQ mutant; ***P<0.001, unpaired t test. ΔKPQ, empa vs vehicle; ***P<0.001, paired t test. Currents in A through D and I were normalized to peak current (denoted by 1-----). G/Gmax indicates test conductance/maximum conductance; I/Imax, test current/maximum current; and peak INa, maximum peak sodium current amplitude.
