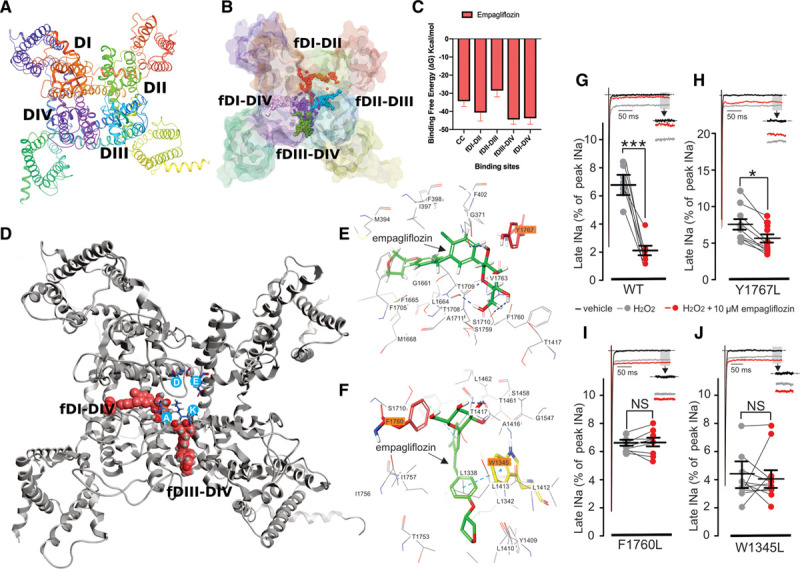
Figure 3.

Molecular modeling of empagliflozin (empa) docking to Nav1.5. A, Macroscopic structure of the human Nav1.5 homology model used in this study. B, Sites chosen for focused docking shown as colored spheres, and dotted circle denotes the central cavity region. C, Molecular Mechanics Generalized Born Solvation Area binding free energies of empa in these different sites presented in Kcal/mol. Error bars, SD. D, Empa structure (crimson) docked to the fDI-DIV and fDIII-DIV sites; Selectivity filter residues are shown in blue circles (D372, E898, K1419, and A1711). E and F, Two-dimensional interaction sketches illustrating the predicted interactions of empa with residues located in the fDI-DIV (E) and fDIII-DIV (F) sites. Residues highlighted in orange are predicted to have significant interactions with the empa molecule (Y1767 in fDI-DIV, and F1760 and W1345 in fDIII-DIV). G through J, Representative whole-cell patch-clamp recordings showing the effects of empa (10 µmol/L) on sodium currents from wild-type (WT; G) and Y1767L (H), F1760L (I), and W1345L (J) mutant Nav1.5 channels. Representative current traces in G through J were normalized to peak-INa. ***P<0.001, *P<0.05, paired t test. Peak INa indicates maximum peak sodium current amplitude.
