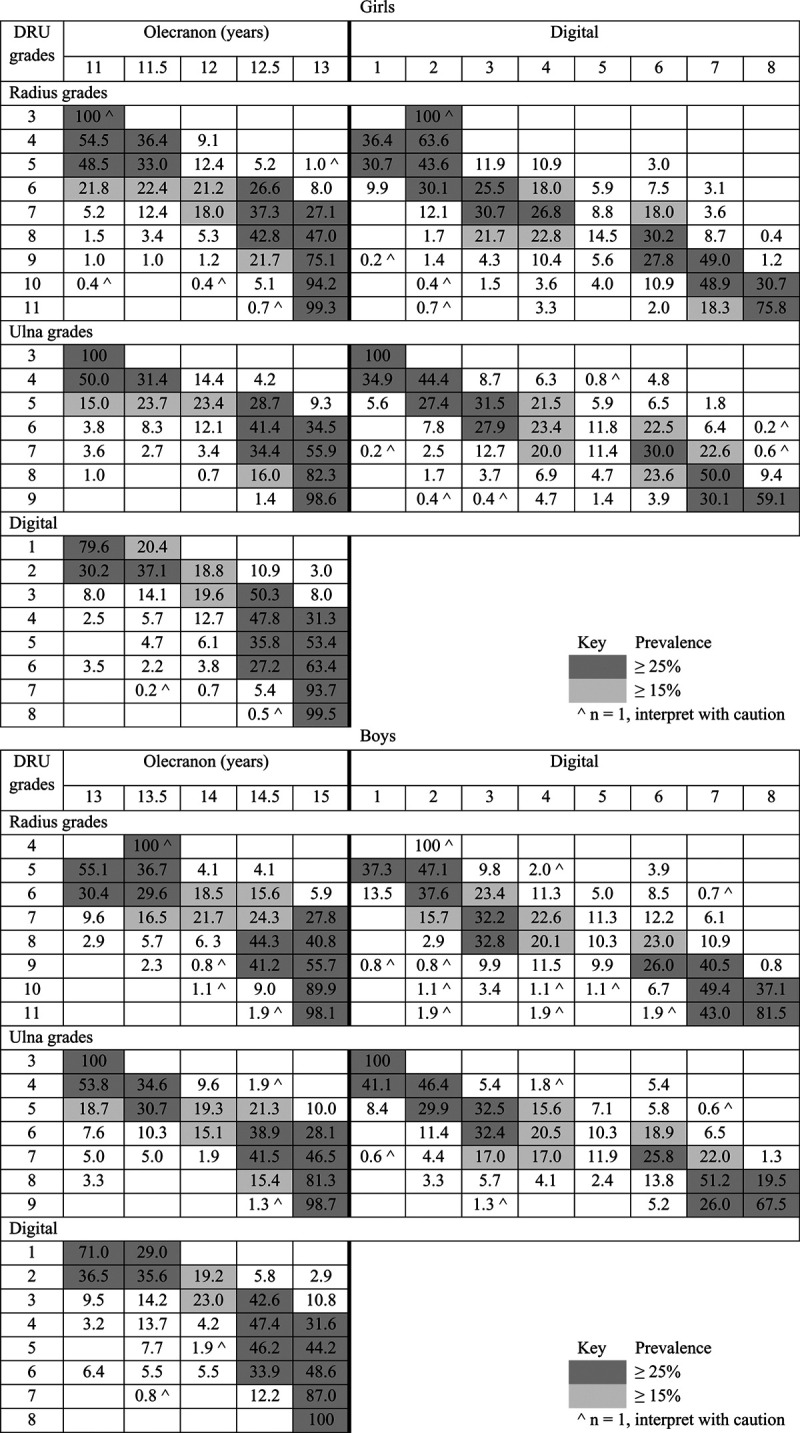
Table 3.
Three-way cross-tabulation of prevalence rates, expressed as percentages in rows, for specific grades of the three skeletal maturity indices in the study population

Three-way cross-tabulation of prevalence rates, expressed as percentages in rows, for specific grades of the three skeletal maturity indices in the study population
