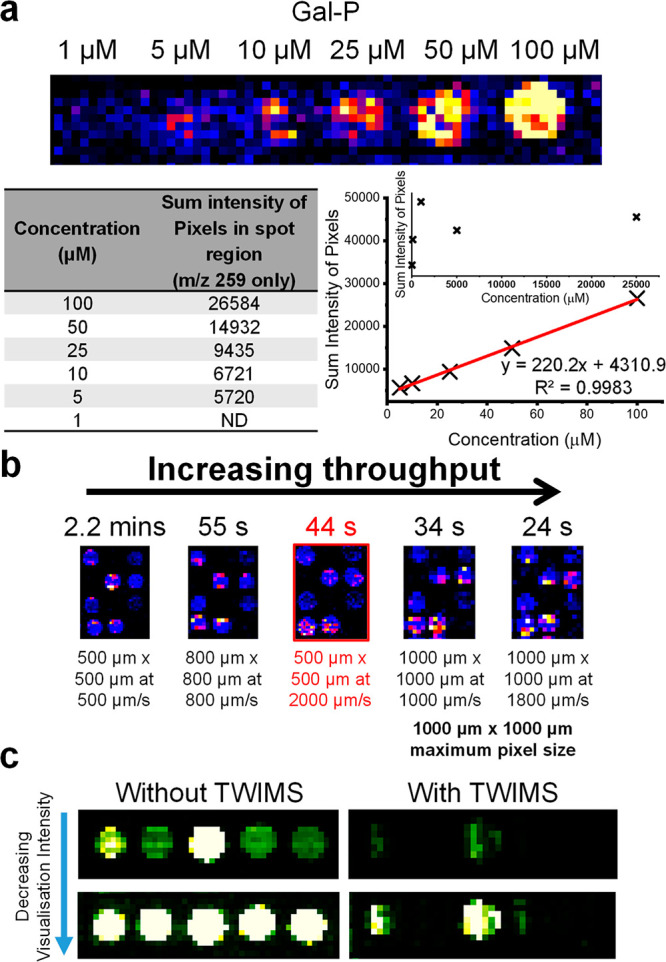
Figure 3.

(a) Mass-resolved heat map indicating the limit of detection of six different concentrations of galactose-1-phosphate using a pixel size of 500 μm × 500 μm and a rate of 2000 μm/s. The intensity of each pixel within each concentration spot has been summed and plotted versus the concentration of that spot. The graph shows good linearity between the concentration of each spot and the summed pixel intensity over the range 5–100 μM. Graph insert illustrates saturation of the compound. (b) DiBT-MS analysis of 12 kinase biotransformations at varying pixel sizes and stage speeds. The resulting throughput per sample has been noted. A 44 s/sample throughput has been highlighted as being the optimal conditions for high-throughput screening without compromising data quality. (c) Heat maps obtained when analyzing IRED reactions in 5 different wells of a metagenomic plate both with (right) and without (left) traveling wave ion mobility (TWIMS) enabled within the SYNAPT mass spectrometer. Two visualizations of each heat map are given to show IM filtering of the substrates’ second 13C isotope ion from the major product ion (m/z 208) within the heat maps.
