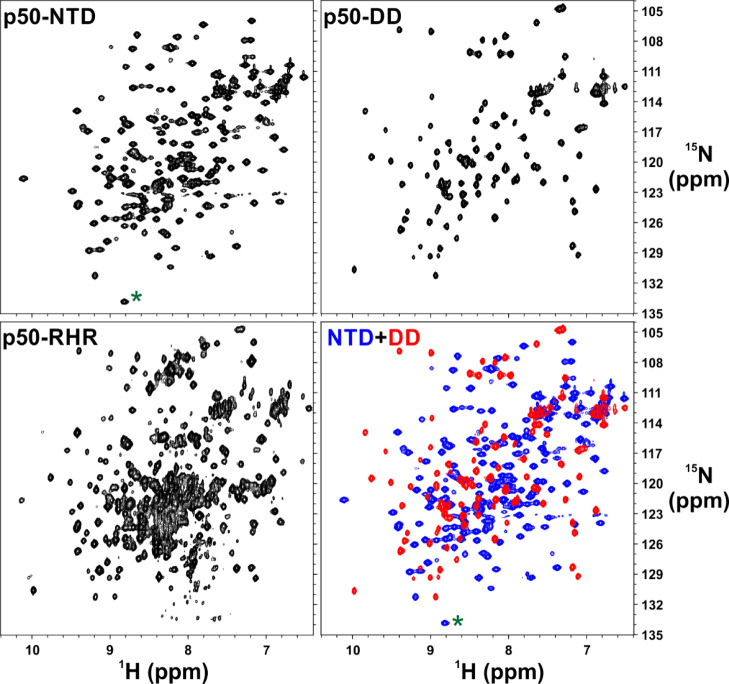
Figure 2.
[15N, 1H]-correlation spectra of the isolated domains of p50 NF-κB subunit represent well-folded protein domains that correlate well with that of the full-length p50 homodimer. [15N, 1H]-HSQC spectra of [15N, 2H]-labeled p50-NTD (top left panel) and 15N-labled p50-DD (top right panel). [15N, 1H]-TROSY spectrum of [15N, 2H]-labeled p50 homodimer (bottom left panel) and superimposed [15N–1H] HSQC spectra of p50-NTD (blue) and p50-DD (red). The folded cross-peak is marked with a green asterisk (*). The p50-RHR (39–363) fragment used here has 13 extra residues at the C-terminal end than the p50-DD (245–350) which accounts for the extra peaks for [15N, 1H]-TROSY p50-RHR.

