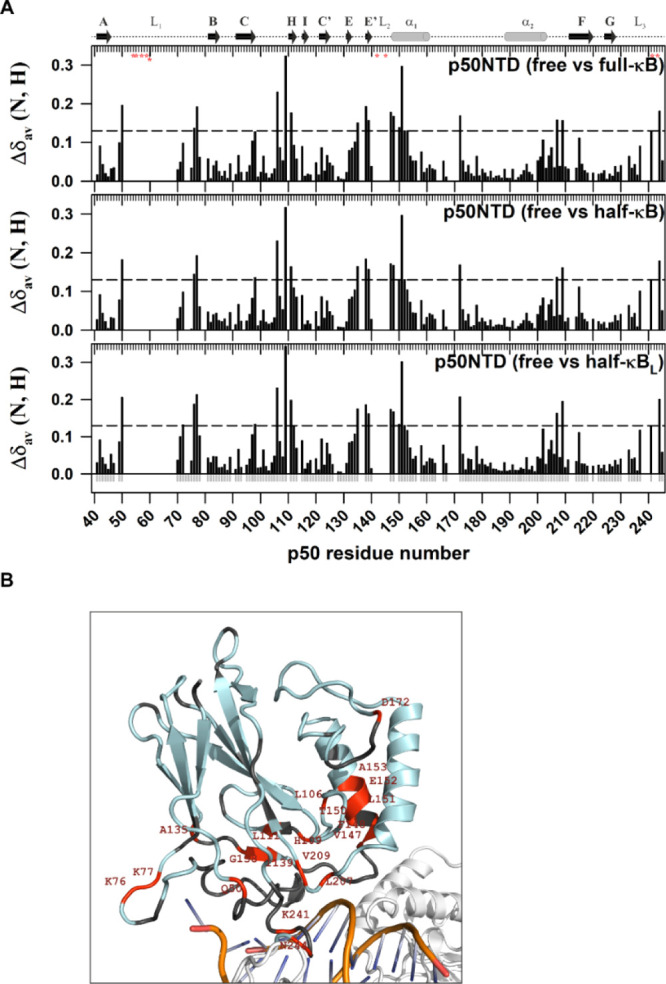
Figure 5.

Chemical shift differences between κB DNA-free and -bound forms of the p50-NTD extend beyond the DNA contacting residues. (A) Plot of CSP [Δδav (N, H) = √[(Δδ1H)2 + (Δδ15N/5)2] observed for the p50-NTD in κB DNA-free and -bound forms as a function of the p50 residue number. The secondary structure with the α-helix is shown as a cylinder and β-strand as an arrow corresponding to the p50-NTD sequence is depicted on the top of the plot. The DNA-contacting residues in the protein are shown as red asterisks below the top ruler. The dashed horizontal line in each panel is the reference which is three standard deviations above the average CSP, excluding the outliers. CSPs above the reference in each panel are considered significant. (B) Significant CSPs mapped onto the 3D structure of p50-NTD (PDB id: 1NFK) are depicted in red. The p50-NTD is colored in light-blue; DNA in golden-yellow with bases shown in blue; and the other parts of the p50-RHR structure are shown in white.
