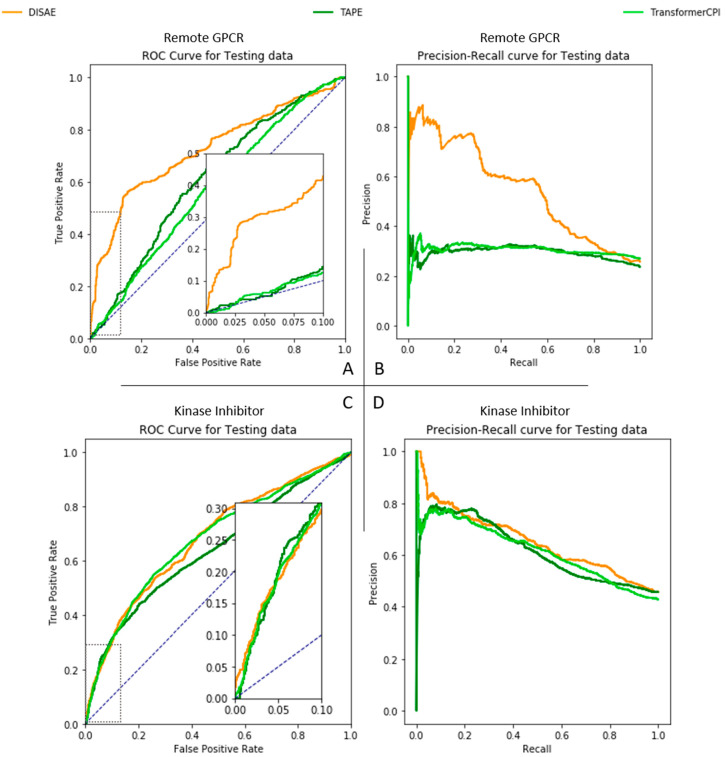
Figure 3.
Performance comparison of DISAE, TAPE, and TransformerCPI. (A and B) ROC- and PR-curves for the prediction of ligand binding to remote proteins. (C and D) ROC- and PR-curves for the classification on testing set in the cross-gene-family kinase inhibitor benchmark. All of the models are trained on distilled triplets.

