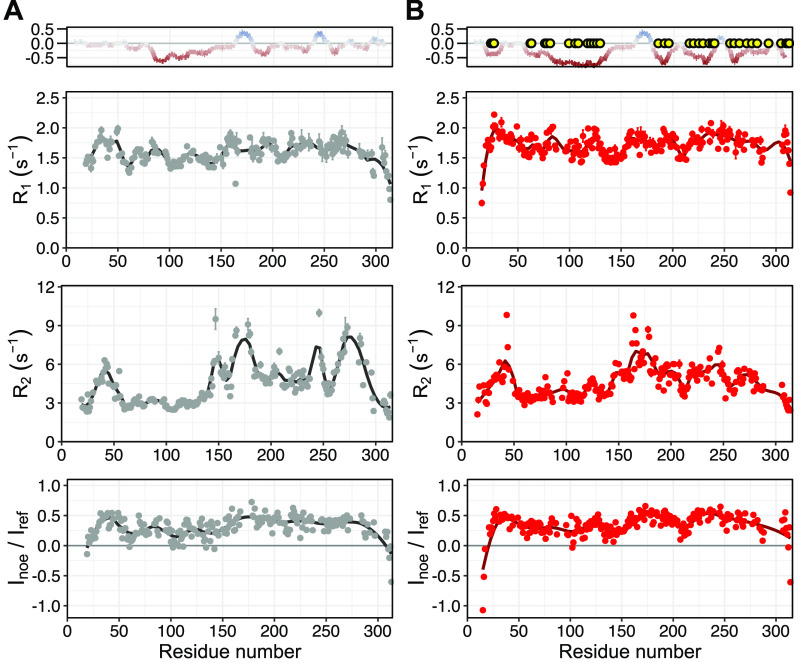
Figure 3.
15N NMR relaxation data of OPN (A) before and (B) after phosphorylation, measured at 18.8 T. A charge plot of the protein sequence is shown at the top. Yellow circles indicate the identified phosphorylated residues. 15N R1, 15N R2, and 15N–{1H} NOE relaxation parameters, from top to bottom, respectively, of OPN measured at 293 K. Error bars indicate the fitting errors (15N R1 and 15N R2) and the error propagation of intensity ratios based on the noise level (hetNOE).

