Figure 5.

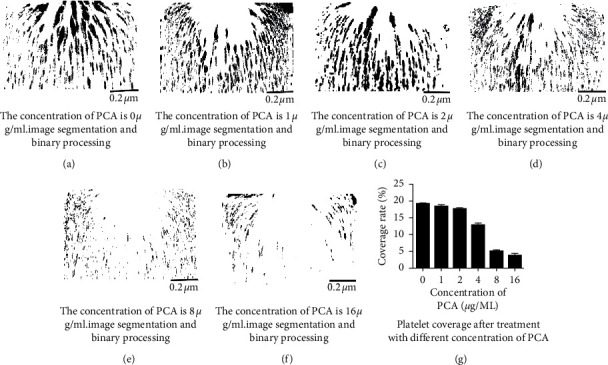
(a–f) Image analysis graphs of platelet coverage. (g) Histogram of platelet surface coverage at different concentrations of protocatechin.

(a–f) Image analysis graphs of platelet coverage. (g) Histogram of platelet surface coverage at different concentrations of protocatechin.