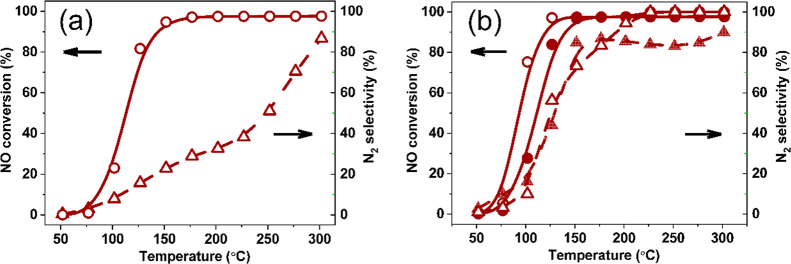
Figure 7.
NO conversion and N2 selectivity on Pd/Fe-CeO2 predicted by microkinetics simulations: (a) NO + CO reaction (PCO = PNO = 0.01 atm) and (b) NO + CO + H2 reaction (PCO = PNO = 0.01 atm, PH2 = 0.005 atm, symbol: open circles and triangles) and NO + CO reaction with excess of CO (PCO = 0.015 atm, PNO = 0.01 atm, symbol: closed circles and triangles).

