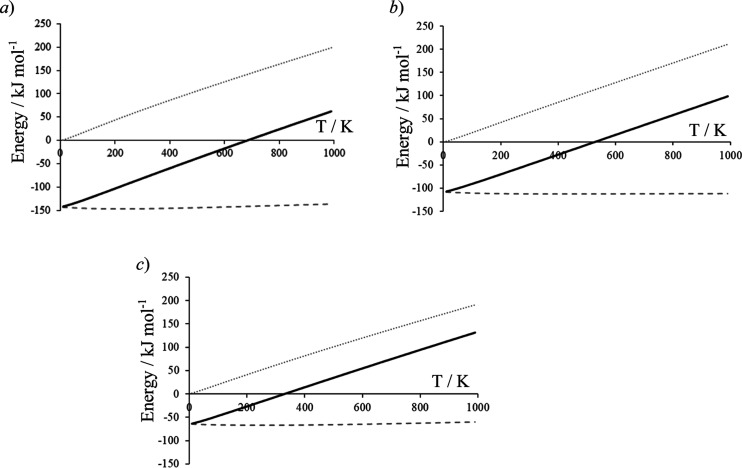
Figure 2.
Calculated free-energy change, ΔG, for water adsorption on ceria surfaces and the contributions from enthalpy, ΔH, and entropy, −TΔS, plotted as a function of temperature. Plots are based on the calculated energies for 1 ML coverage with the inclusion of vibrational ZPE and calculated normal modes. Plots are for (a) CeO2(100), (b) CeO2(110), and (c) CeO2(111). For each plot, ΔG: solid line, ΔH: dashed line, and −TΔS: dotted line.

