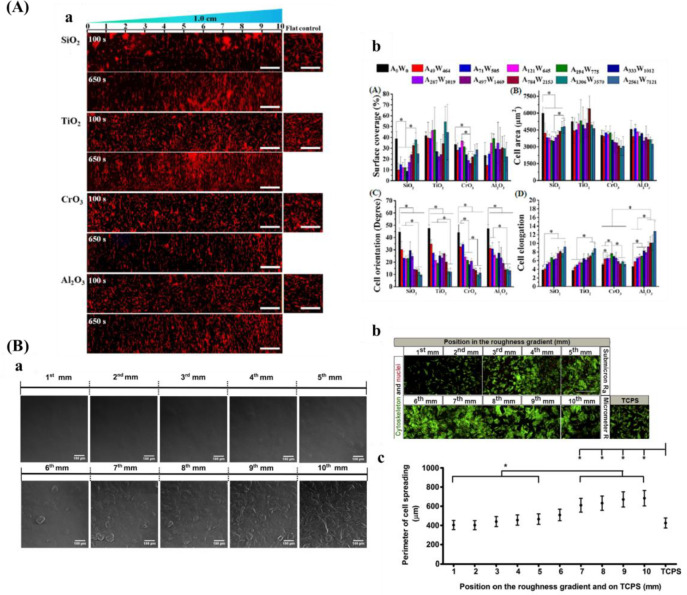
Figure 11.
(A) (a) Fluorescent staining of the gradients. Red color is for cytoskeleton. (b) Cell macroscopic behaviors. Reprinted with permission from ref (100). Copyright 2017 American Chemical Society. (B) (a) SEM of the polycaprolactone roughness gradient. (b) F-actin staining at day 4. (c) Quantified cell perimeter along the gradient after 4 days. Reprinted with permission from ref (181). Copyright 2014 Elsevier, Ltd.

