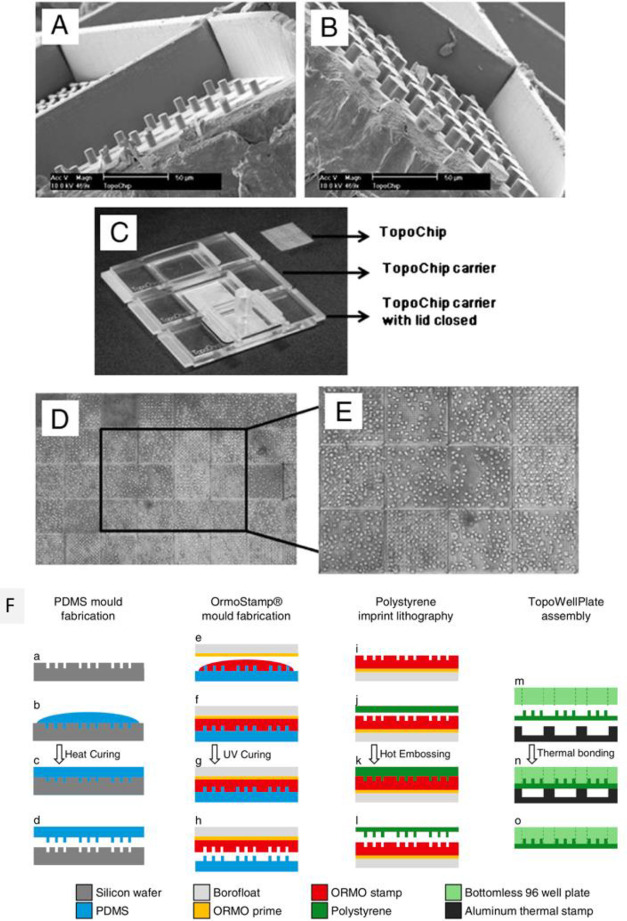
Figure 21.
Representative microarrays to investigate the effect of topographical features on cell phenotype. (A–E) TopoChip characterization. Reprinted with permission from ref (455). Copyright 2011 National Academy of Sciences. (A, B) SEM images of a section of TopoChips, displaying accurate feature replication (scale bar = 50 μm), (C) image of the TopoChip carrier, lid and chip assembly, (D, E) light microscopy images of cells seeded onto the TopoChip displaying homogeneity of cell distribution within and between TopoUnits. (F) TopoWellPlate fabrication scheme. Reprinted with permission from ref (51). Copyright 2011 Wiley-VCH. representing the following steps (a) silicon master mold containing the inverse structures of the selected topographies is used to (b) cast a layer of PDMS, followed by (c) curing of the PDMS layer and (d) peeling off from the silicon master. (e) OrmoPrime is applied to a Borofloat wafer, followed by application of OrmoStamp onto the PDMS mold, (f) which is spread by capillary forces, (g) UV curated and (h) peeled off from the mold. The hot embossing process involves (i) the inverse OrmoStamp mold is aligned (j) to the polystyrene film followed by (k) hot embossing and (l) gentle peeling off. The patterned polystyrene film is then (m) aligned to the bottomless 96-well plate and an aluminum thermal stamp, followed by (n) thermal bonding, resulting in (o) a leakage-free well plate containing defined surface substrates.

