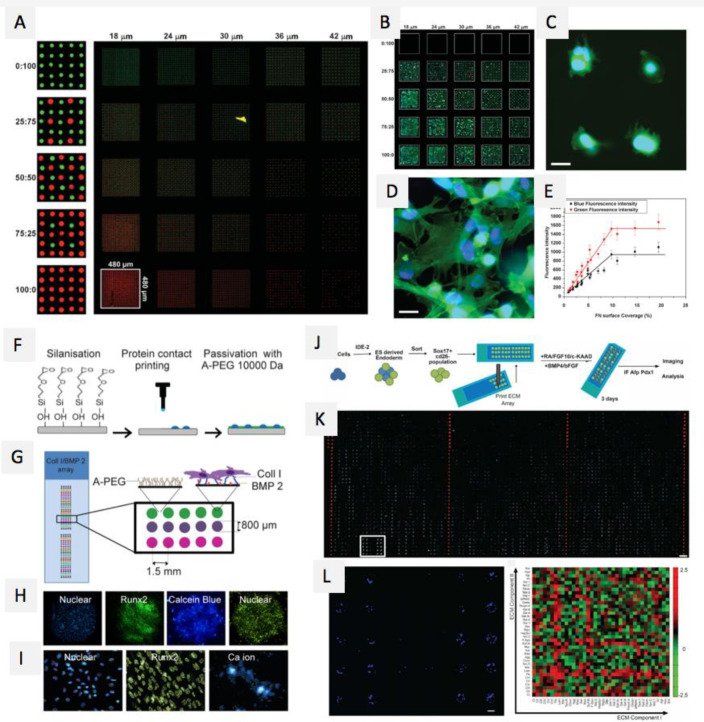
Figure 23.
Microarray technologies based on animal-derived biomolecules. Reprinted with permission from ref (437). Copyright 2008 Wiley-VCH. (A) Fluorescent image of a two-component protein array, composed of 25 different combinations of mini-arrays (white square marks one mini-array), red spots are Alexa-546-labeled fibrinogen and green spots are FITC-labeled BSA, the numbers at the top of representing the distance between spots and the numbers on the left are the ratio of red: green spots. (B) Collage of fluorescence images of C2C12 myoblast cell adhesion on fibronectin arrays after a 3h incubation on protein arrays with different spot spacing, (C, D) enlarged images of the red squares gown in panel B, scale bar = 20 μm. (E) Correlation between fibronectin surface coverage and cell density (black line) or cell spreading (red line). (F–I) Microarray fabrication. Reprinted with permission from ref (417). Copyright 2016 Elsevier, Ltd. (F) Schematic of the cell microarray formation, (G) Typical cell microarray platform with various protein ratios. (H) Fluorescent images of the slide acquired using automated fluorescence microscopy for nuclear localization (Hoechst 33342) and osteogenic markers (Runx2, Calcein Blue). (I) Automated analysis for the detection and measurement of nuclear count and osteogenic marker presence (yellow line in Runx2 and blue line in Calcein Blue, Ca ion). (J–L) Microarray strategy. Reprinted with permission from ref (489). Copyright 2016 Elsevier, Ltd. (J) Schematic of the experimental approach, with 4000 features (including positive and negative controls) on a single glass slide, (K) representative image of complete ECM microarray 12 h post cell-seeding with definitive endoderm cells, image represents the 4000 features in the array, nucleus and cytoplasm are labeled with fluorescent dyes (blue and green, respectively) and red spots are rhodamine-dextran spots utilized as negative controls and for alignment of image acquisition, scale bar = 1 mm. (L) Inset from panel B (white box), including cell nuclei label only and illustrating a representative set of ECM islands in quintuplicate, scale bar = 100 μm. Right graph shows a heatmap quantification of endoderm cell adhesion 12 h postseeding. Each feature represents the combination formed by 2 different ECM molecules on the x and y axes.

