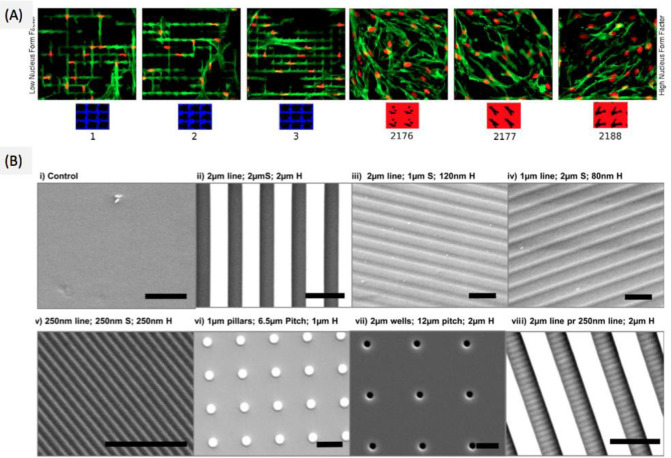
Figure 28.
Features of cell-based topographical microarrays. (A) Fluorescent images ranking surfaces by nucleus roundness of human MSCs growing on patterned PLA surfaces; the three lowest and three highest-ranked surfaces are represented. The topographies are represented and colored according to a Mann–Whitney U-test ranking. Cells show nuclear (red) and cytoskeleton (green) staining. Reprinted with permission from ref (144). Copyright 2015 Elsevier, Ltd. (B) High fidelity of PDMS patterns generated from the MARC master molds by soft lithography. SEM images of (i) unpatterned PDMS control, and (ii–viii) patterned topographies, with the description of patterned size (line width or pillar and well diameter, μm), pattern spacing (μm) and pattern height (μm), in that order. The perpendicular pattern is also indicated with the abbreviation (pr). Scale bar = 5 μm. Reprinted with permission from ref (571). Copyright 2013 Elsevier, Ltd.

