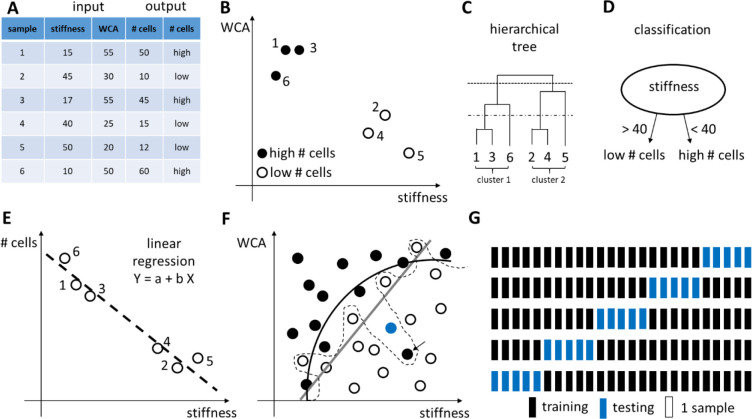
Figure 42.
Basic principles of data analysis: data exploration and statistical modeling. (A) Input and output data matrix. (B) Scatterplot of the number of cells as a function of stiffness and WCA. Every sample is one data point. (C) Hierarchical clustering of the 6 data points into a dendrogram. The dendrogram or tree can be cut at any height to determine data clusters. Cutting the tree at the highest level (dashed line) results in 2 clusters (samples 1–3–6 and 2–4–5). Cutting the tree at a lower level (broken line) results in 4 clusters (samples 1–3, 6, 2–4, and 5). (D) On the basis of stiffness, the data points can be classified into two groups: high # cells and low # cells. (E) Simple linear regression where the dependent variable Y (here: the amount of cells) is predicted using the independent variable X (here: stiffness). (F) Classification of data points into two classes (open and solid circles) with an underfitted (gray line), reasonable (black curve), and overfitted (dashed curve) decision boundaries. The overfit is influenced by one black data point (arrow) and would classify a new point (blue dot) as a solid circle, which would probably be an error. (G) Example of K-fold cross-validation with K = 5. Reprinted with permission from refs (55) and (972). Copyright 2017 Elsevier, Ltd. and 2016 Nature Publishing Group.

