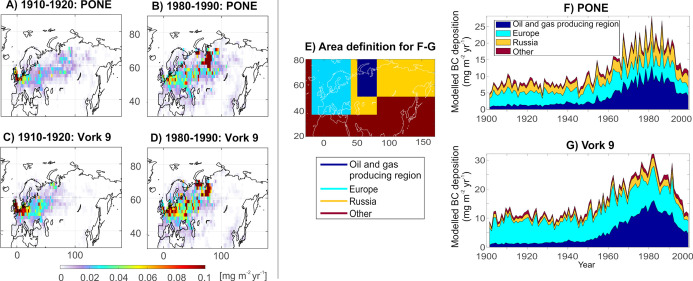
Figure 4.
Source areas of BC deposited at the study lakes PONE and Vork 9 between 1900 and 1999. (A–D) 10 year averaged source contribution maps (mg m–2 yr–1) for PONE and Vork 9 for the period of 1910–1920 and 1980–1990. (E) Area definition for the panels (F,G). (F,G) Temporal variation of source contributions from the oil and gas producing region, the rest of Russia, Europe, and the rest of the world (other) sources in the 20th century.

