
Figure 2.
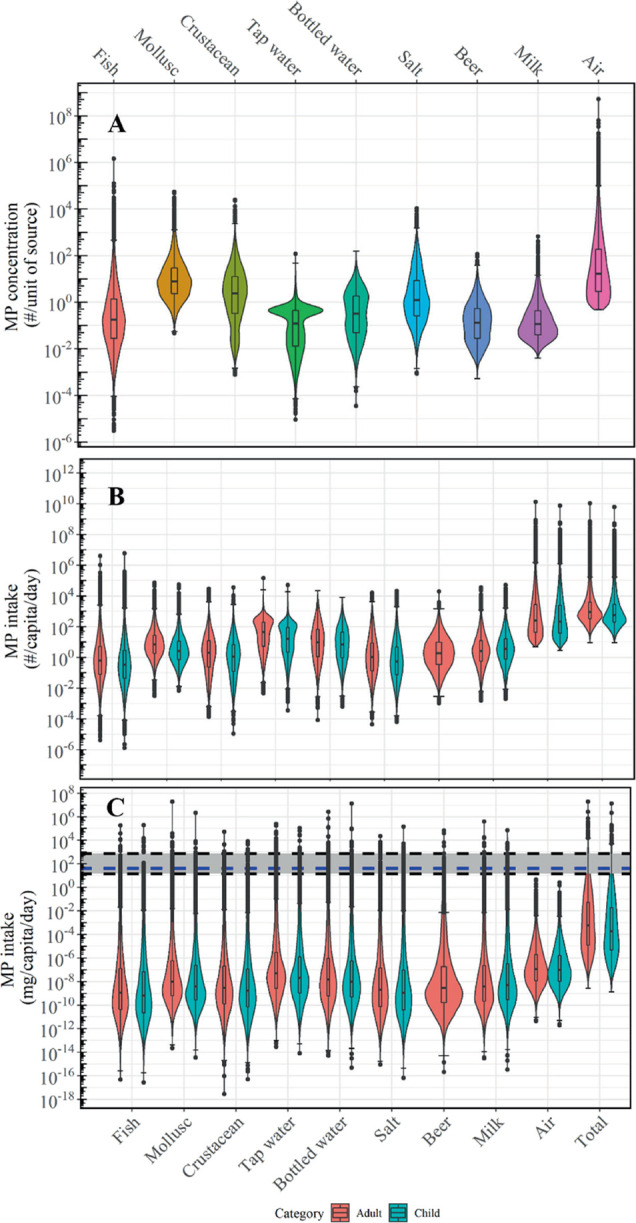
MP concentrations and intake in each source. (A) Violin plots of MP concentration in food (1–5000 μm) and air (1–10 μm). Concentrations are presented as per gram of body wet weight (BWW) for fish and crustacean, per gram of tissue wet weight (TWW) for mollusc, per liter for all liquids, per gram for salt, and per cubic meter for air. (B) Violin plots of MP number intakes (particles/capita/day) and total MP number intake from food and air for an adult and child. (C) Violin plots of MP mass intakes (mg/capita/day) and the total MP mass intake from food and air for an adult and child. Black dashed lines and the shaded gray region (14–714 mg/capita/day) indicates the range of mass intake estimation by WWF,101 and the blue dashed line (40 mg/capita/day) indicates the mass intake of inorganic particles.102 The box plot is showing the median (middle line) and interquartile range (box length). Note that data are only realistic within the 95% confidence interval (horizontal line on the whiskers of the box plot).