Figure 5.

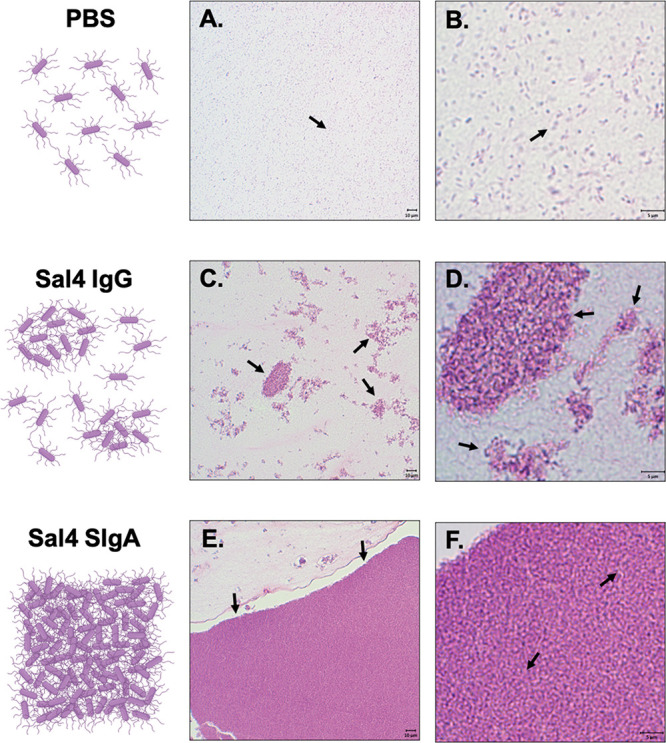
H&E staining of STm agglutination by Sal4 SIgA and IgG. Mid log phase ATCC14028 STm cells were treated with (A, B) PBS or 50 μg of (C, D) Sal4 IgG or (E, F) Sal4 SIgA, pelleted, and immobilized in bovine–thrombin plasma clots as described in the Methods. Clots were fixed and prepared for paraffin-embedding and sectioning. Samples were counterstained with H&E to visualize STm–antibody aggregates. (A, B) STm cells in PBS were uniformly dispersed as single cells. (C, D) Sal4 IgG generated numerous clusters of STm bacteria primarily arranged in lacy and irregular patterns that appeared loosely packed. (E, F) Sal4 SIgA treatment induced large sheets of tightly packed bacteria that spanned the field of view on the microscope. Single cells were rarely observed in SIgA-treated cells compared to PBS and IgG groups. Scale bars depict 10 μm (low magnification) and 5 μm (high magnification) as indicated.
