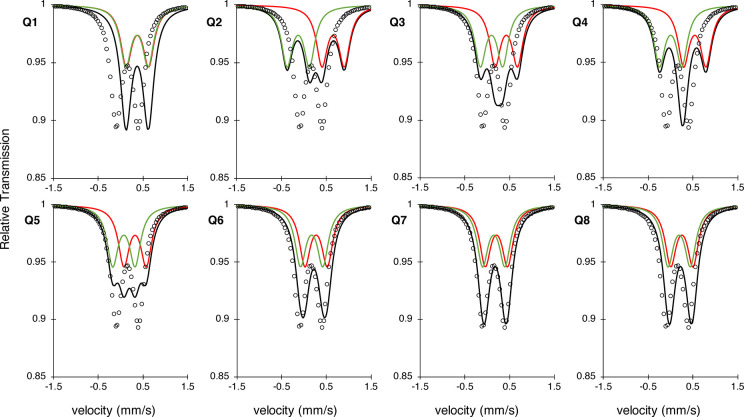
Figure 10.
Simulated Mössbauer spectra of the two calculated isotope shifts (red, green) and their resulting spectrum (black), using the average of the experimental quadrupole splitting (0.5). The simulated spectrum using the experimental MMOHQ values (dots) is added to provide a visual comparison that allows judgment of which model represents the experiment most accurately.

