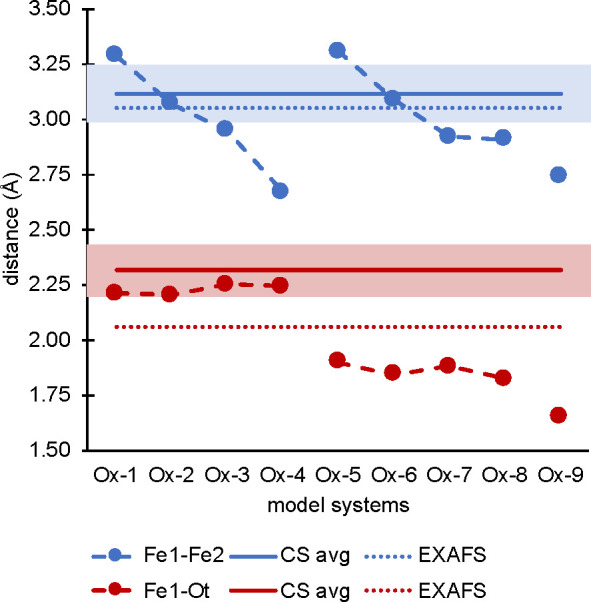
Figure 6.

Graphical representation of the geometry analysis. Left: Difference of the Fe–Fe and Fe–Ot bond lengths in the models vs the crystal structure average of the 13 intact crystal structures presented in Table 1 and EXAFS distances.28 Full lines denote the crystal structure average, dotted lines denote the EXAFS fits, and pastel bars denote the standard deviation. Note that only the shorter EXAFS Fe–O distances were included.
