
Figure 3.
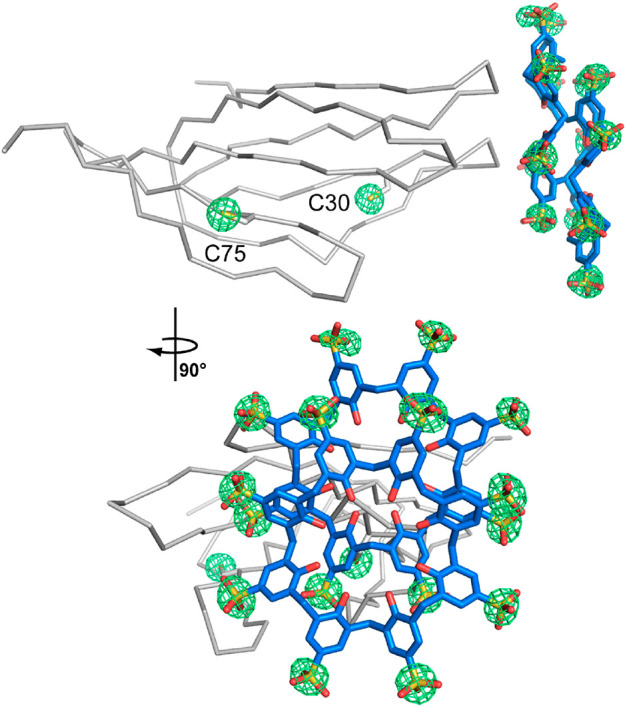
Fourier maps (green mesh) calculated from sulfur anomalous data and contoured at 4.0 σ in crystal form II (I23). The RSL monomer is shown as the Cα trace, the sclx8 dimer and cysteine side chains are shown as sticks.
Official websites use .gov
A
.gov website belongs to an official
government organization in the United States.
Secure .gov websites use HTTPS
A lock (
) or https:// means you've safely
connected to the .gov website. Share sensitive
information only on official, secure websites.
Fourier maps (green mesh) calculated from sulfur anomalous data and contoured at 4.0 σ in crystal form II (I23). The RSL monomer is shown as the Cα trace, the sclx8 dimer and cysteine side chains are shown as sticks.