
Figure 5.
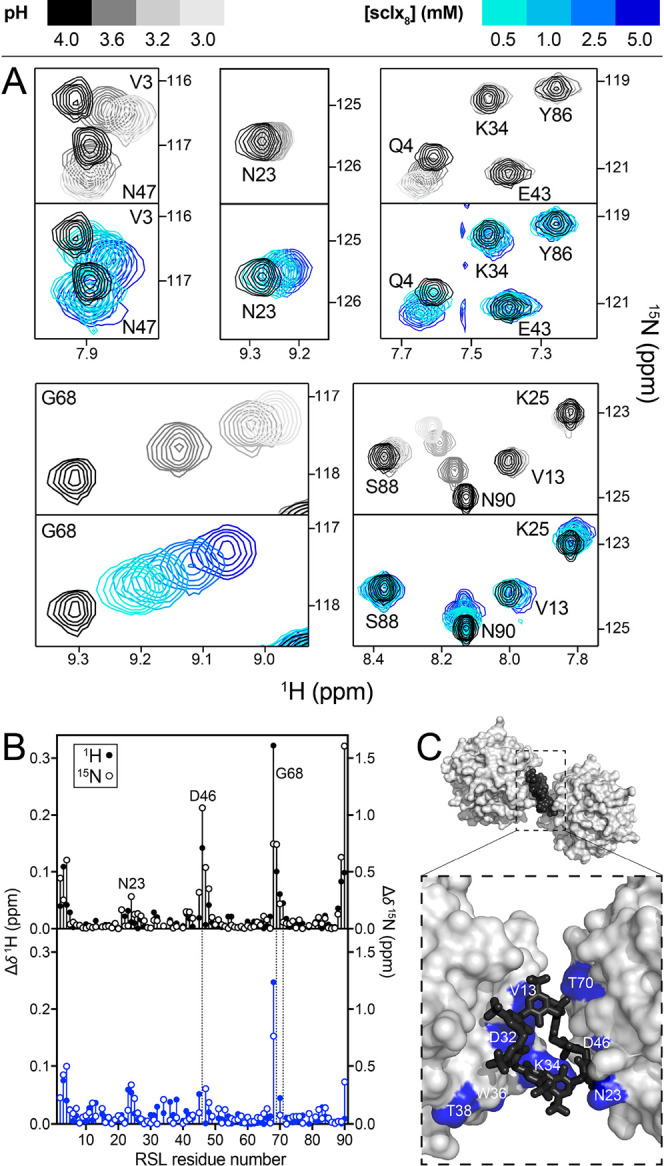
(A) Regions from overlaid 1H–15N HSQC spectra of RSL during pH (gray scale) or sclx8 (color scale) titrations. (B) Chemical shift perturbation plots of RSL backbone amides in response to pH adjustment (pH 4.0–3.0) or to the addition of 5 mM sclx8 (at pH 4.0). Dashed lines indicate unassigned resonances due to overlap. (C) Detail of the RSL-sclx8P3 assembly (Figure 2) showing RSL trimers in surface representation and bridging sclx8 as black spheres or sticks. Significant chemical shift perturbations at 5 mM sclx8 are highlighted blue.