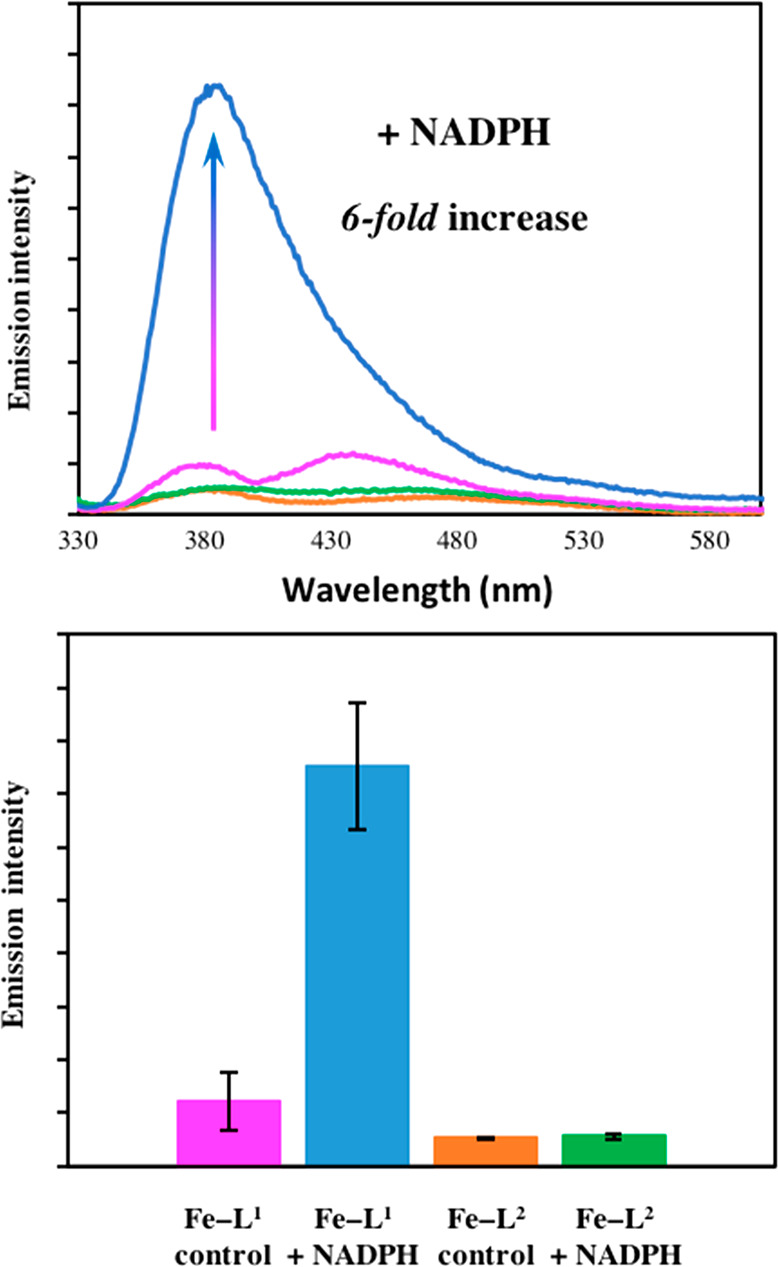
Figure 5.

(A) Coumarin emission intensity of Fe–L1 and Fe–L2 in E. coli lysates with or without 16 h incubation with 1 mM NADPH. (B) Bar chart showing the average change in fluorescence intensity. Error bars represent the standard deviations of five independent experiments. Fe–L1 control (pink), Fe–L1 + NADPH (blue), Fe–L2 control (orange), and Fe–L2 + NADPH (green). Concentration = 50 μM, λex = 320 nm, 298 K, slits 5:5.
