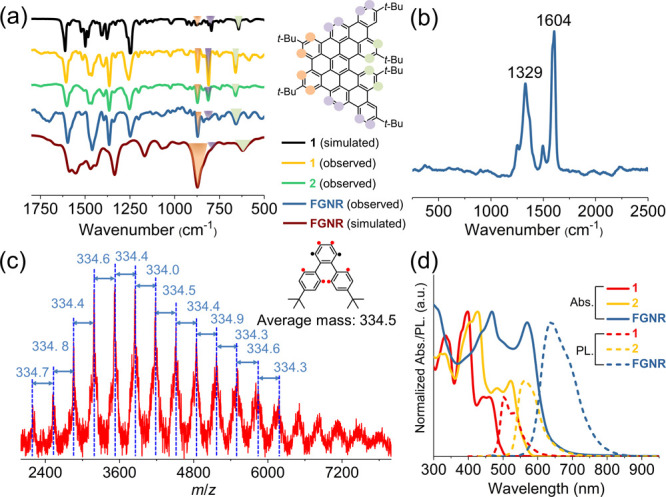
Figure 2.

(a) FT-IR spectra of 1, 2, and FGNR measured on powder samples and DFT-calculated spectra of 1 and FGNR at the HSE06/6-31G(d) level. (b) Raman spectrum of FGNR recorded with a 488 nm excitation laser (baseline subtraction was carried out because of the strong fluorescence background of FGNR). (c) MALDI-TOF MS analysis of FGNR (matrix: tetracyanoquinodimethane, linear mode). (d) UV–vis and photoluminescence spectra of 1 and 2 (10–5 M) and FGNR (0.1 mg/mL) in THF.
