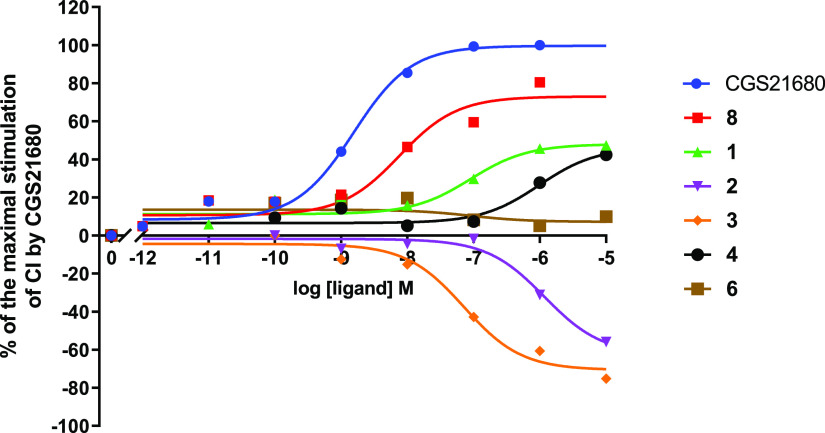
Figure 3.
Concentration–response curves for CGS21680 and nonriboside compounds at HEK293hA2AR derived from the peak analysis of cell index (CI) changes obtained in the xCELLigence RTCA system. The cellular responses were normalized and shown as % of the maximal CI by 1 μM CGS21680. Representative graphs from one experiment performed in duplicate.

