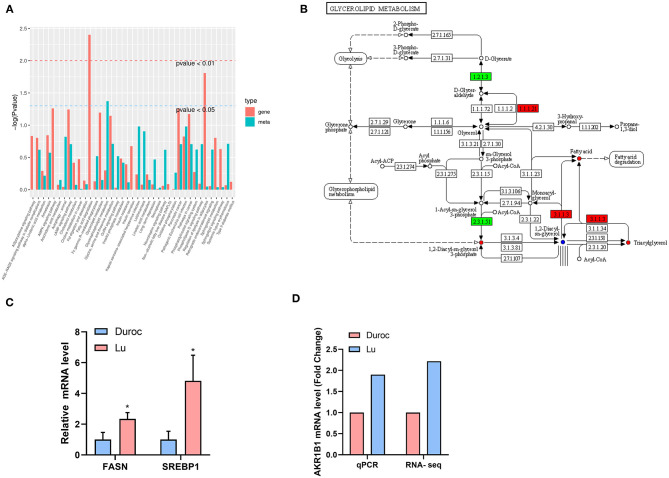
Figure 7.
Joint analysis of transcriptome and metabolomics. (A) Enrichment of pathway genes and metabolites (red represents the enriched P-value of differential genes, and green represents the enriched P-value of differential metabolites). (B) Differential genes and differential metabolites of the same group of the KEGG pathway (red represents upregulation, green represents downregulation, and blue represents both upregulation and downregulation). (C) Lipid synthesis related genes. FASN, fatty acid synthase; SREBP1, Sterol-regulatory element binding protein 1. (D) Key genes expression of glycerolipid metabolism pathway. AKR1B1, Aldo-Keto Reductase Family 1 Member B 1. The data are expressed as mean ± SD. *P < 0.05.

