
Fig. 1. LRIG1 expression decreases during melanoma development.
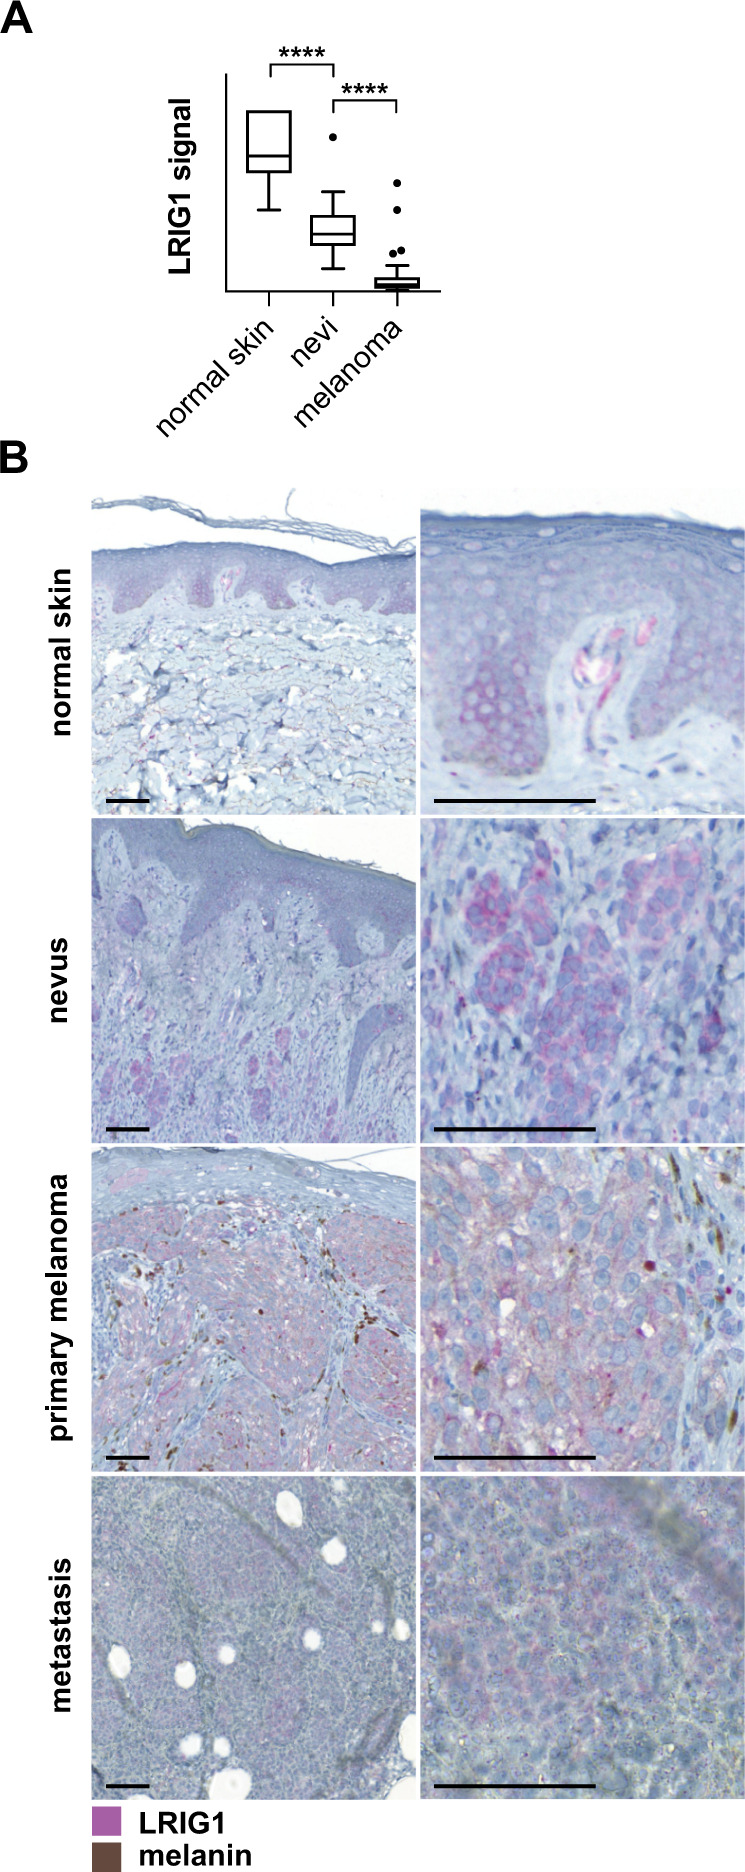
A Normalized microarray data on LRIG1 expression from normal skin tissue (N = 7), benign nevi (N = 18), and primary melanoma (N = 45). The boxplot shows Tukey whiskers. Statistical significance was determined with Dunnett’s multiple comparisons test. ****P < 0.0001. B Micrographs showing tissue sections from normal skin, nevus, primary melanoma, and metastatic melanoma stained with the Atlas anti-LRIG1 antibody. Scale bars are 100 μm.