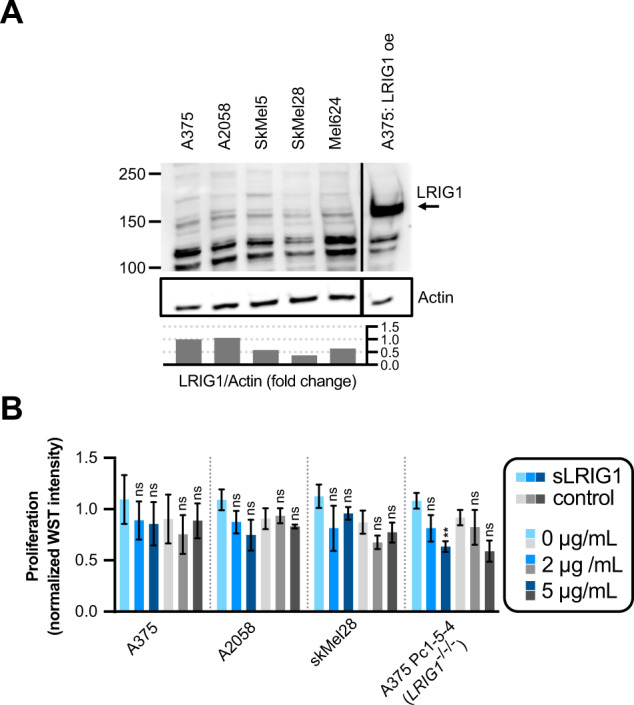
Fig. 6. LRIG1 knockout cells are sensitive to treatment with recombinant LRIG1 ectodomain.

A Western blot analysis of LRIG1 protein expression in a panel of melanoma cell lines. The blot has been cropped vertically for clarity. Quantifications are indicated as the LRIG1/Actin fold change from A375. B Proliferation (WST intensity) after treatment with recombinant protein in four different cell lines. Normalization between experiments was done separately for each individual cell line by division with the mean WST intensity value of the two untreated (0 μg/mL) conditions. Concentrations of supplemented proteins are indicated for recombinant LRIG1 ectodomain (sLRIG1, blue bars) and His-MBP-Strep control protein (gray bars). Statistical significance vs. 0 µg/mL protein was tested using a two-way ANOVA with a Tukey’s multiple comparisons test.
