
Fig. 7. BRAF inhibitor-resistant cells lose LRIG1, gain EGFR and become sensitized to recombinant LRIG1 ectodomain treatment.
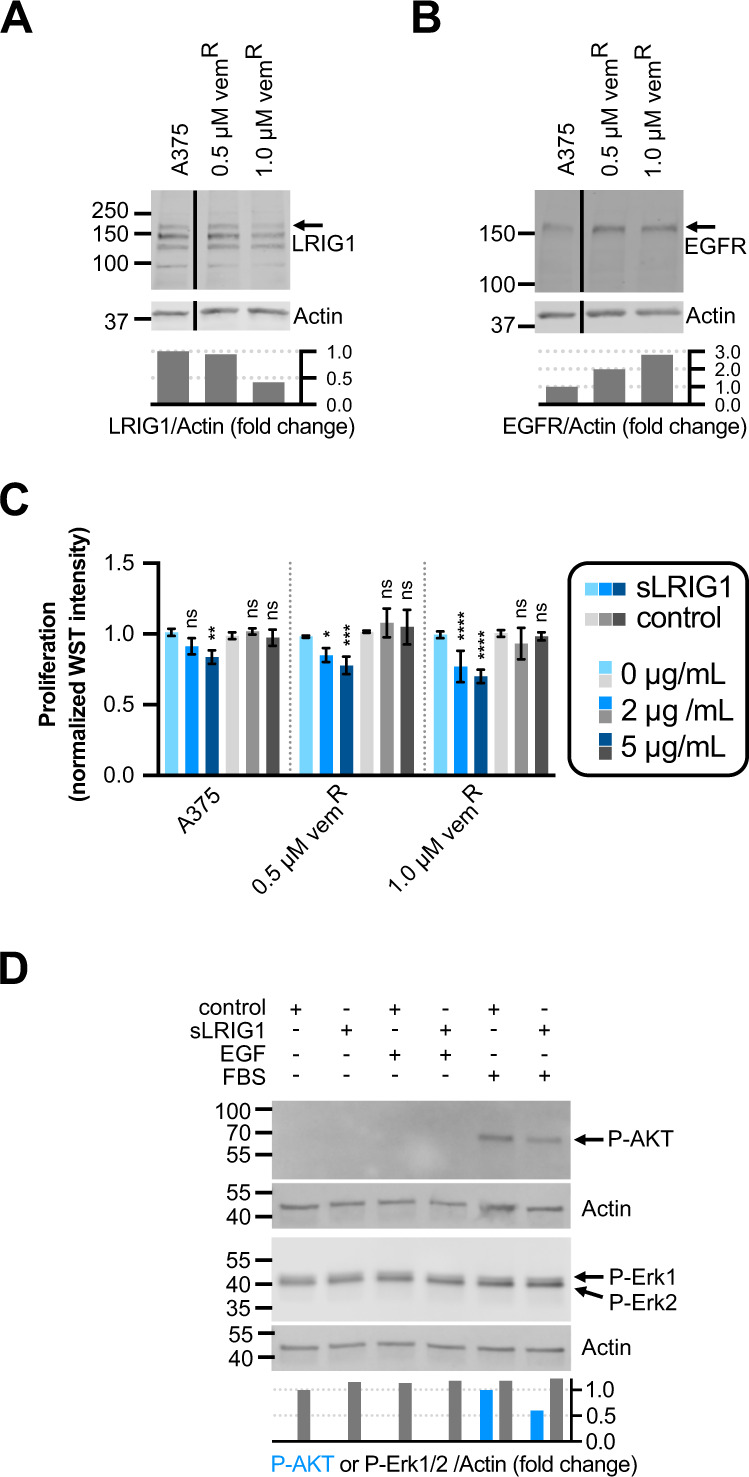
A, B Western blot showing protein expression in naïve A375 cells and two resistant lines with increasing levels of vemurafenib resistance probed for (A) LRIG1 and (B) EGFR. The blots have been cropped vertically for clarity. Quantifications are indicated as the LRIG1/Actin or EGFR/Actin fold change from A375 respectively. C Proliferation (normalized WST intensity) after treatment with recombinant protein in four different cell lines. Normalization and statistics were performed as in Fig. 6B. Concentrations of supplemented proteins are indicated for recombinant LRIG1 ectodomain (sLRIG1, blue bars) and His-MBP-Strep control protein (gray bars). D Western blots on cell lysates form vemurafenib-resistant cells, stimulated as indicated and probed for phospho-AKT and phospho-Erk1/2. Quantifications are indicated as the phospho-AKT/Actin fold change from FBS-stimulated cells treated with control peptide or as the phospho-Erk1/2/Actin fold change from serum-starved cells treated with control peptide.