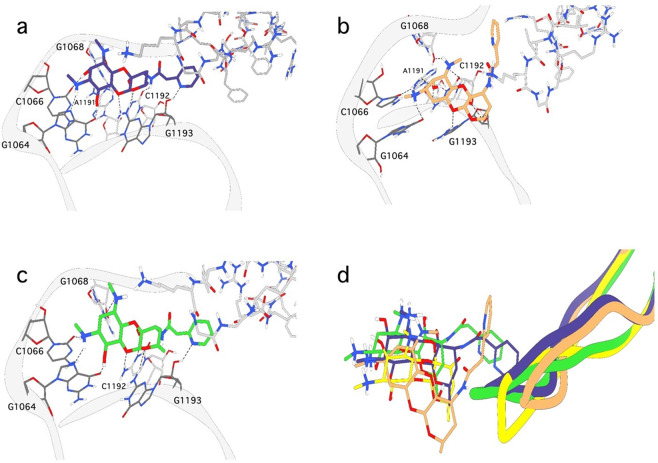
Fig. 7.
Modeled binding modes of spectinamide analogs from 20 ns molecular dynamic simulation in AMBER18. The binding mode of a 2, b 6, and c 10 from 20 ns MD simulations. The protein is rendered as a gray ribbon with nucleotides and waters interacting with the ligand shown as sticks. The dashed lines represent hydrogen bonding interactions. d An overlay of spectinomycin (yellow), 2 (purple), 6 (orange), and 10 (green) from the 20 ns MD simulations

