
Figure 2.
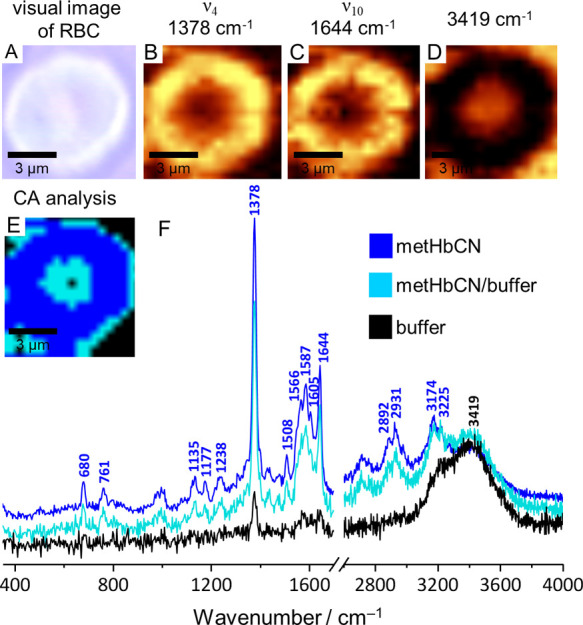
Visual image (×60) of the RBC sample with Raman images, based on the integrations of ν4 (1378 cm–1) and ν10 (1644 cm–1) and the solution region (3419 cm–1), with the CA image and the corresponding averaged Raman spectra.
Official websites use .gov
A
.gov website belongs to an official
government organization in the United States.
Secure .gov websites use HTTPS
A lock (
) or https:// means you've safely
connected to the .gov website. Share sensitive
information only on official, secure websites.
Visual image (×60) of the RBC sample with Raman images, based on the integrations of ν4 (1378 cm–1) and ν10 (1644 cm–1) and the solution region (3419 cm–1), with the CA image and the corresponding averaged Raman spectra.