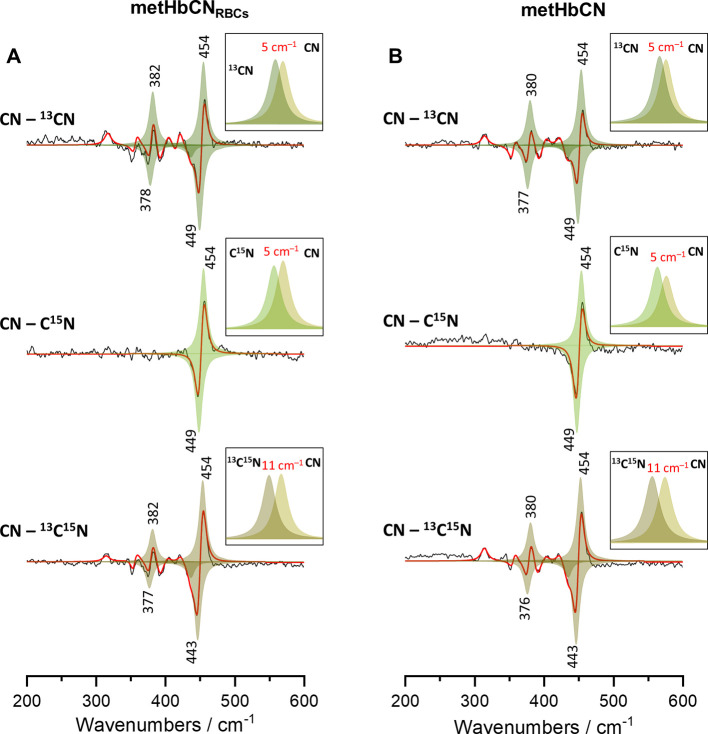
Figure 4.
Difference patterns calculated based on the rR difference patterns shown in Figure 3 (black lines) with the simulated traces (red lines) and fitted peaks (shades of green) based on Lorentzian band shape assumption. Panel A corresponds to the spectra presented in Figure 3A obtained for RBCs rich in HbCN adducts, whereas Panel B corresponds to the spectra from Figure 3B obtained for isolated HbCN adducts.

