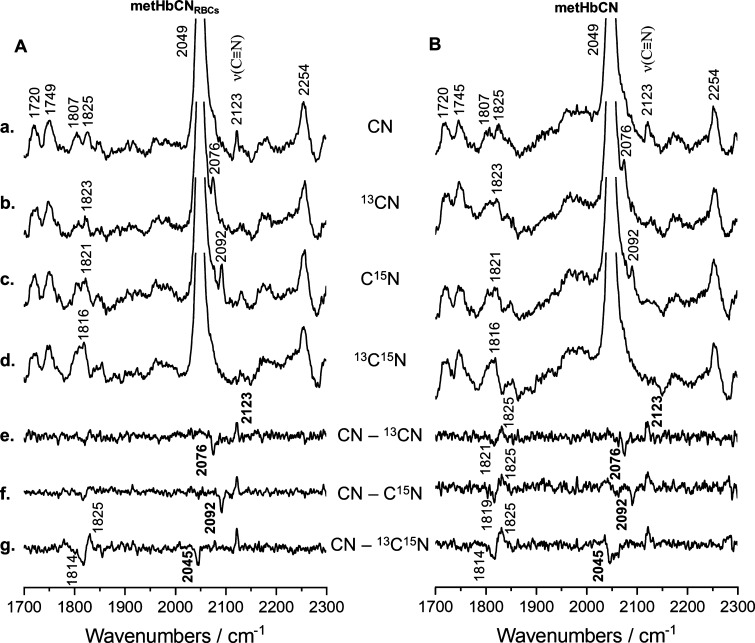
Figure 5.
rR spectra of RBCs rich in metHb (A) and isolated metHb (B) treated with potassium cyanide (a) and its isotopic analogues (K13CN—b, KC15N—c, and K13C15N—d) in 10-fold molar excess compared to the heme concentration. Spectra were recorded using a 406.7 nm excitation line with power at the sample set approximately to 5 mW and are presented in a high wavenumber region (1700–2300 cm–1) with appropriate difference patterns (e–g). All spectra were averaged from three independent experiments from 13 single spectra in total (1/3/9 spectra per experiment). Acquisition time was equal to 5 min per spectrum (20 s and 15 accumulations).

