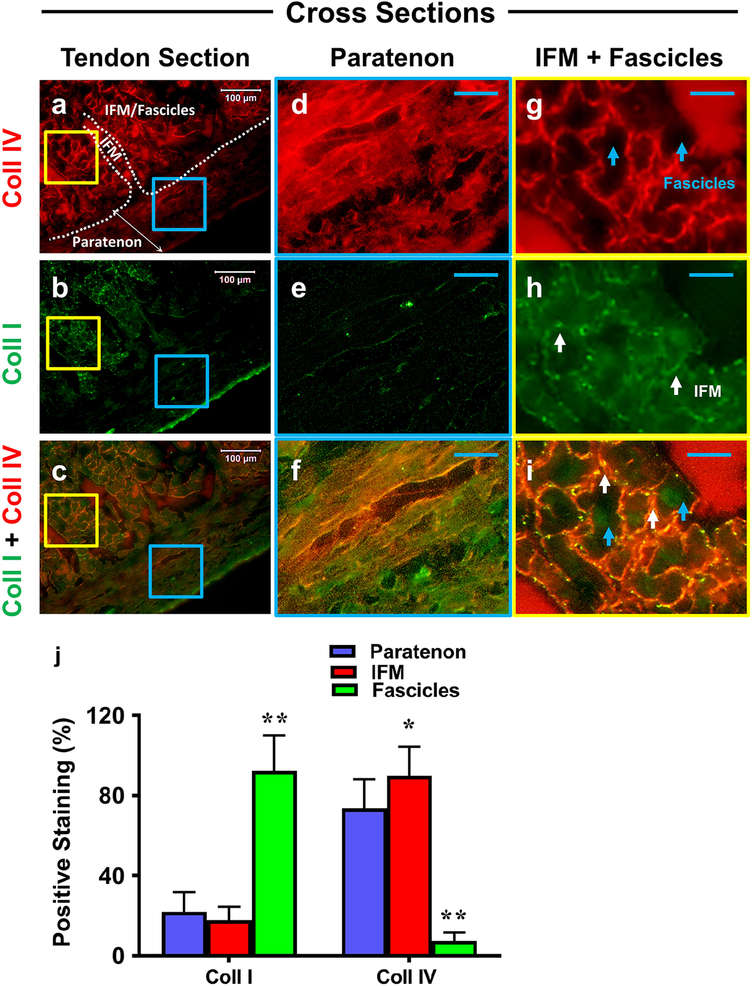
Fig. 5. The differential collagen expression in paratenon, IFM, and fascicles.
Cross-sectional tissue sections were evaluated for collagen I (green fluorescence) and collagen IV (red) expression by immunofluorescent staining. Whole tendon tissue staining in images a-c, with enlarged images in blue and yellow boxes in d-f and g-i, respectively. Images c, f, and i represent merged images. Clear boundaries between the paratenon and IFM/Fascicles are represented within a by a white boundary line and appropriate labels. Paratenon tissues are positively stained for collagen IV (d, f), and collagen I (e, f), albeit its level appears lower than collagen IV. The IFM tissues are positively stained by collagen IV (g, i), but produced low levels of collagen I staining (net-like structure, white arrows in h, i). Fascicle tissues show strong positive staining by collagen I (h, i), but they are negatively stained by collagen IV (blue arrows in g, i). Semi-quantification of these images is displayed in figure j. *p < 0.001(IFM compared to paratenon); **p < 0.001 (fascicles compared to paratenon and IFM). White bars: 100 μm; Blue bars: 25 μm.

