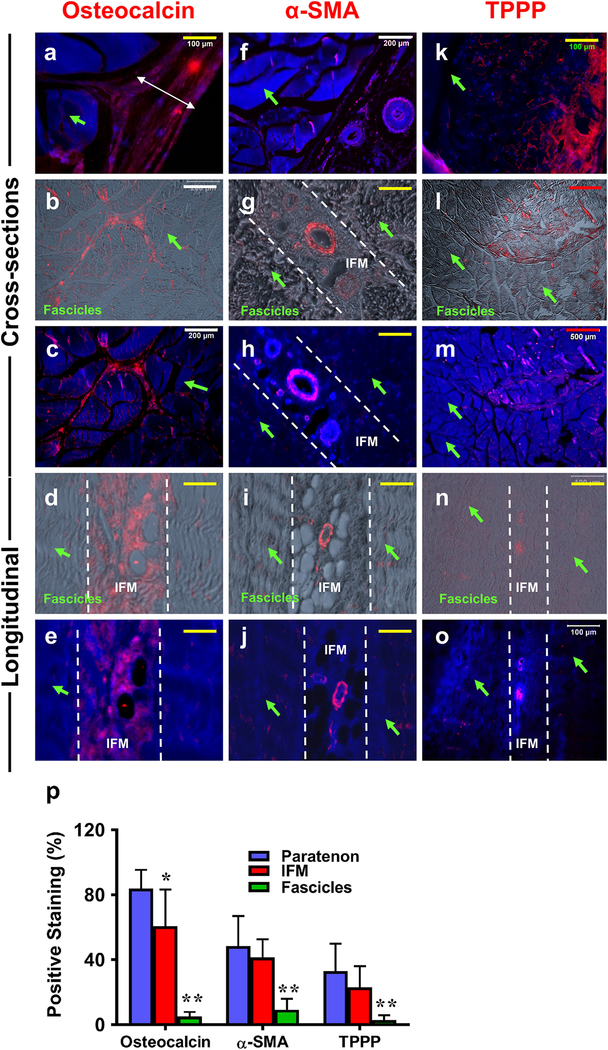
Fig. 9. Osteocalcin, alpha-smooth muscle actin (α-SMA), and tubulin polymerization promoting protein (TPPP) expression on PAT tissue sections determined by immunostaining.
a-e: Osteocalcin staining; f-j: α-SMA staining; k-o: TPPP staining. Cross and longitudinal sections are labeled on the left of the image. a, c, e: The cells were stained with H33342 (blue) and osteocalcin (red); f, h, j: The cells were stained with H33342 (blue) and α-SMA (red); k, m, o: The cells were stained with H33342 (blue) and TPPP (red); b, d: Merged images of osteocalcin (red) and phase contrast images; g, i: Merged images of α-SMA(red) and phase contrast images. l, n: Merged images of TPPP (red) and phase contrast images. The results showed that the paratenon (a) and IFM (b-e) are positively stained for osteocalcin, but fascicles are negatively stained by osteocalcin (green arrows in a-e). The blood vessel-like tissues within the paratenon (f) and IFM (g-j) are specifically stained for α-SMA, but both overall IFM and fascicles are negatively stained by α-SMA (white lines demarcating the IFM, green arrows for fascicles in f-j). Paratenon tissues are positively stained by TPPP (red fluorescence in k), while a low amount of staining can be seen within IFM tissues (red fluorescence in l-o). No fascicles are positively stained for TPPP (green arrows k-o). Semi-quantification is displayed in figure p, *p < 0.001 (IFM compared to paratenon); **p < 0.001 (fascicles compared to both paratenon and IFM). White bars: 200  m; Yellow bars: 100
  m; red bars: 500
  m.
m.

