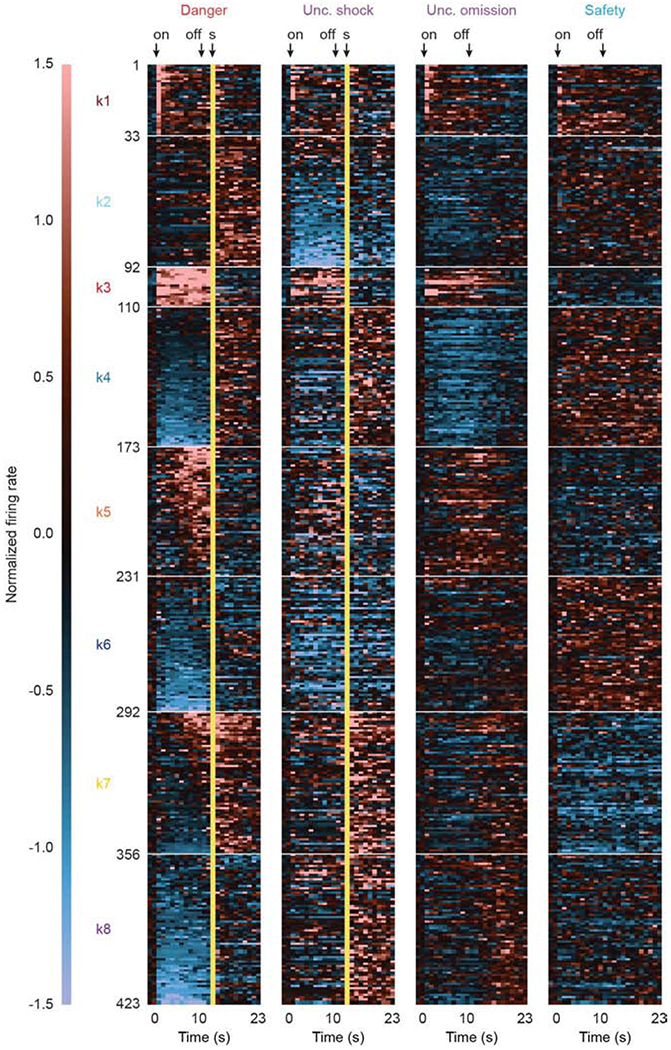
Figure 2. Heat plot and clustering of cue-responsive neurons.

Heat plot showing mean normalized firing rate for each cue-responsive neuron (n = 423), from pre-cue through post shock, in 1-s bins for each of the four trial types: danger (red), uncertainty shock (purple), uncertainty omission (purple), and safety (blue). Cue-responsive neurons are divided into eight clusters (k1-8). A normalized firing rate of zero is indicated by the color black, with greatest increases light red and greatest decreases light blue. Cue onset (on) and offset (off) are indicated by black arrows. Foot shock delivery indicated by yellow bars. See also Figure S2.
