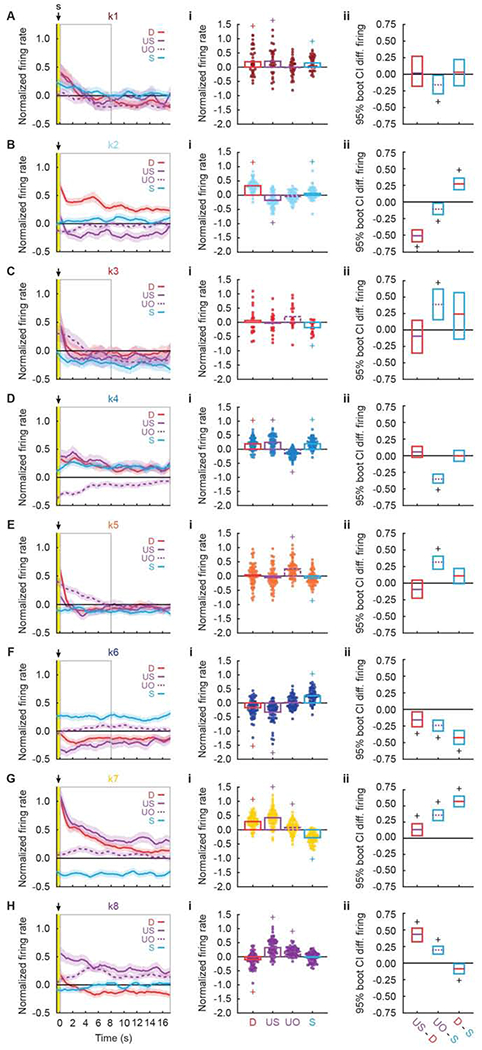
Figure 6. Aversive outcome firing by cluster.

(A, left) Mean normalized firing rate to danger (D, red), uncertainty shock (US, solid purple), uncertainty omission (UO, dashed purple), and safety (S, blue) is plotted for the 17.5 s following shock offset for k1 neurons (n = 33, currant). Yellow bar indicates shock period and gray box indicates interval analyzed in A, i, ii. Foot Shock delivery is indicated by black arrow. (A, i) Mean normalized firing rate for each k1 neurons (data points), as well as the mean for all k1 neurons (bars) is shown for each trial type (colors maintained from above). (A, ii) The mean, upper bound and lower bound of the 95% confidence interval (CI) for differential firing to uncertainty shock vs. danger (left), uncertainty omission vs. safety (middle) and danger vs. safety (right) are shown. Identical plots are constructed for (B) k2 (n = 59, sky blue), (C) k3 (n = 18, red), (D) k4 (n = 63, blue), (E) k5 (n = 58, orange), (F) k6 (n = 61, dark blue), (G) k7 (n = 64, yellow), and (H) k8 (n = 67, purple) neurons. +95% bootstrap confidence interval for normalized firing rate does not contain zero (colored plus signs). +95% bootstrap confidence interval for differential firing does not contain zero (black plus signs). See also Table S4.
