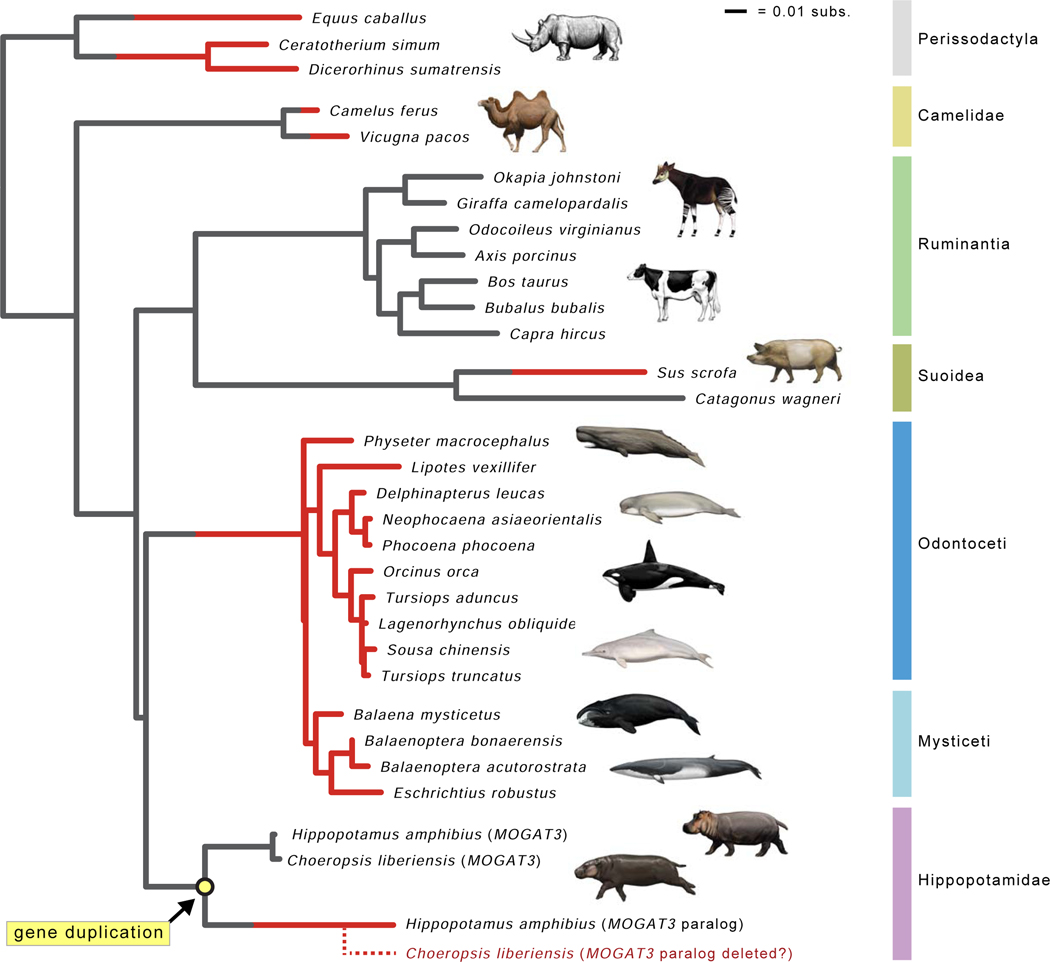
Figure 4. Gene tree for MOGAT3.
The gene tree for MOGAT3 shows inferred gene duplication event in Hippopotamidae (yellow circle) and parallel gene inactivations (red lineages). Seven gene knockouts are inferred, including pseudogenization of the MOGAT3 paralog that was derived from a duplication event on the stem hippopotamid branch. Lineages with functional MOGAT3 are gray, and lineages with inactivated MOGAT3 are colored red. Branches where inactivation events (frameshift indels, premature stop codons) were inferred by parsimony optimization of indels are gray and red, indicating the transition from functional to non-functional. The dashed red lineage for Choeropsis liberiensis represents hypothesized deletion of the MOGAT3 paralog in the genome of this species. Branch lengths are in expected numbers of substitutions per site.

